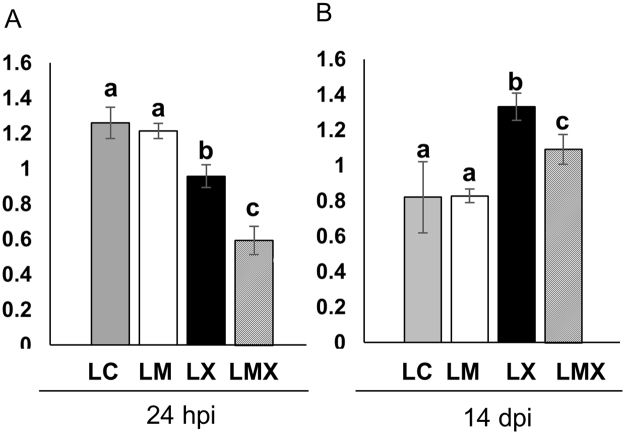
Figure 7.
Protein carbonylation profiles in leaves of control and mycorrhizal wheat plants after Xantomonas infection at earlier (24 hpi) (A) and later (14 dpi) (B) time points. Each bar represents the protein carbonylation index, measured as ratio between the optical density (OD) obtained from the whole lane of the immunoblot and the OD of Coomassie stain. Data (means ± SD, n = 3) were subjected to one-way analysis of variance (ANOVA). Bars not accompanied by the same letters are significantly different at the 5% level using Tukey’s test.

