Figure 2.
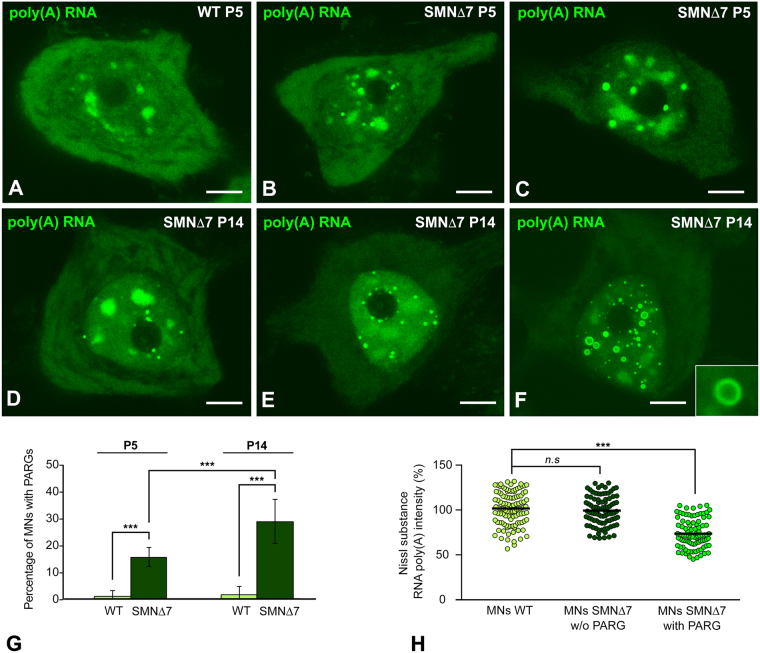
FISH for poly(A) RNAs in WT and SMN∆7 MNs at P5 and P14. (A) Typical distribution of Poly(A) RNA concentrated in nuclear speckles and the Nissl substance and diffuse in the nucleoplasm in a WT MN at P5. (B,C) Formation of PARGs in SMN∆7 MNs at P5. Note the association of PARGs with the nucleolus and nuclear speckles (B,C) and the reduced hybridization signal in the Nissl substance in panel C. (D–F) Distribution of poly(A) RNAs in SMN∆7 MNs at P14 showing three progressive stages of PARG accumulation in neuronal perikarya. Note the presence of two categories of PARGs, compact (D,E) and ring-shaped (F and inset), and the cytoplasmic depletion of poly(A) RNAs in MNs containing a large number of PARGs (E,F). Scale bar: 4 µm. (G) Proportion of MNs containing PARGs at P5 and P14. PARGs are already visible at P5 but the percentage of MNs containing PARGs notably increases during the late symptomatic stages (P14); p values from data comparison of the percentage of PARG-containing MNs: WT vs. SMN∆7 = 3.1E-9 at P5 and 2.7E-8 at P14; SMN∆7 P5 vs. SMNΔ7 P14 = 1.5E-4 (***p < 0.0005). (H) Scatter dot plots of the fluorescence intensity signals of poly(A) RNAs in the peripheral cytoplasm (Nissl substance) of WT and SMN∆7 MNs at P14. Each dot represents the fluorescence signal of poly(A) RNA intensity from a single MN (mean of four measurements). The horizontal black line represents the mean for each group normalized to 100% of the WT group. A significant reduction in the relative concentration of poly(A) RNAs is observed in PARG-containing SMN∆7 MNs (n = 93) compared with both WT and SMN∆7 MNs without PARGs (n = 112 and n = 90, respectively). p = 4.8E-24 from WT and SMN∆7 data comparison (***p < 0.0005).

