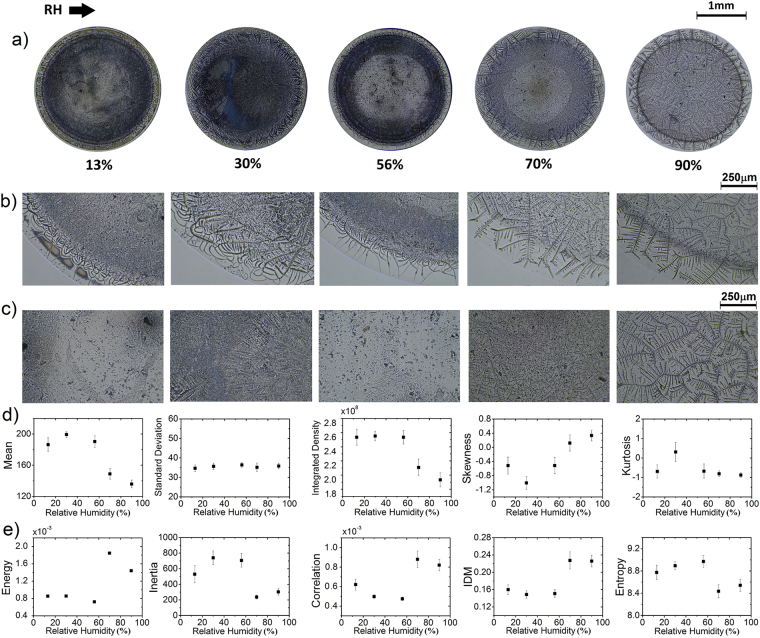
Figure 3.
Proteins mixtures deposits formed at different RH. (a) Deposits containing protein mixture of BSA-LYZ and NaCl (protein concentration ϕr = 5:1, ϕp = 1.6 wt%, and NaCl concentration ϕ = 1 wt%) at different RH and T = 25 °C. Patterns formed at the edge (b) and center (c) of the deposits. The corresponding texture analysis (d) FOS (Mean, Standard Deviation, Integrated density, Skewness and Kurtosis) and (e) GLCM (Energy, Inertia, Correlation, IDM and Entropy). The error bars correspond to standard deviations from n = 24.

