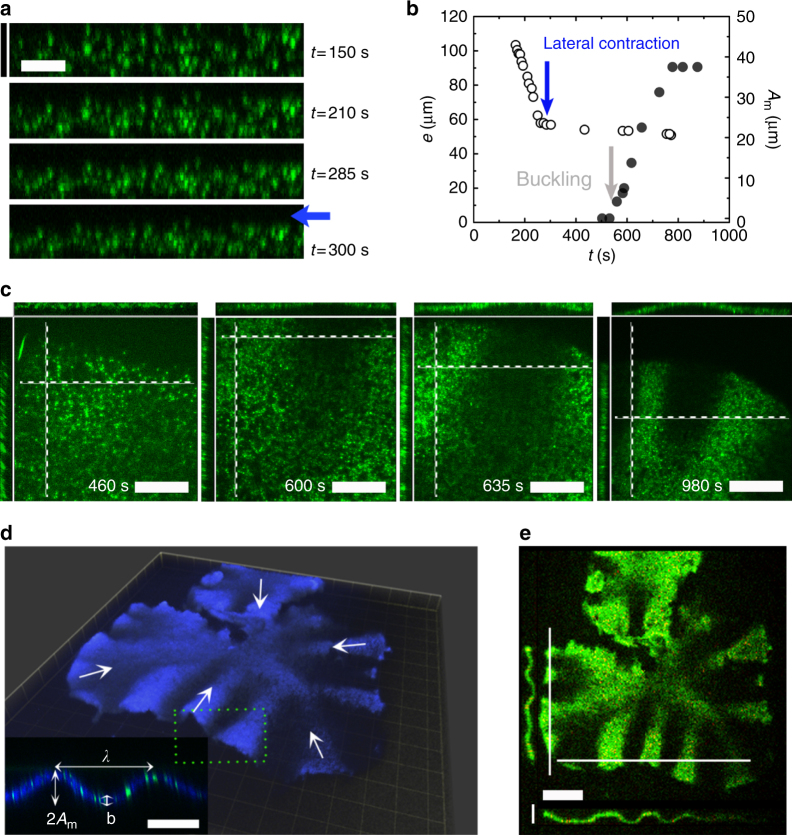
Fig. 2.
Buckling of an acto-myosin sheet. a Spinning disk confocal fluorescence micrographs of actin in the xz plane of a contracting gel. The blue arrow marks the time when lateral contraction sets in and indicates the direction of contraction. Vertical scale bar: 100 μm, horizontal scale bar: 50 μm. b Evolution of gel height e and buckling amplitude Am for the gel in a. The blue arrow marks the time when lateral contraction sets in and the gray arrow marks the time when the sheet starts to buckle at the periphery. c Spinning disk confocal fluorescence micrographs of the actin gel in a in the xy plane (top view), the xz plane (top side view), and yz plane (left side view). Side views (xz and yz planes) are measured along the white dotted lines. Scale bar: 180 μm. d Laser scanning confocal micrograph of a three-dimensional view of a buckling gel at steady state. Inset: side view of the gel indicating the wavelength λ, final gel thickness b, and buckling amplitude Am. Scale bar: 100 μm. e Top view (xy plane) and side views (xz and yz planes) along the white lines of the gel in d. Horizontal scale bar: 200 μm. Vertical scale bar: 80 μm. Drop volume is 4.9 μL (a–c) and 4.6 μL (d, e). Chamber height h = 160 μm (a–c), h = 80 μm (d, e). Initial gel radius R = 3.1 mm (a–c), R = 4.3 mm (d, e). Actin was labeled with Alexa-Fluor 488 (green in a, c, e, blue in d), myosin was labeled with Alexa-Fluor 568 (green in d, red in e). d, e Same gel as in ref. 5 Fig. 7f

