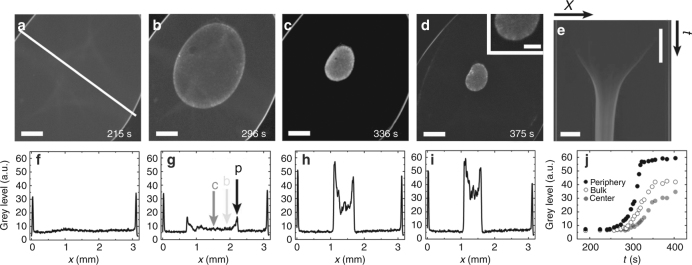
Fig. 5.
Density fields of buckling contracting sheets. a–d Subsequent epifluorescence micrographs of a buckling contracting sheet at low magnification. The buckles appear as straight bright strips at the gel periphery (d). Inset (d): zoom in at the bottom of the gel showing buckling. Scale bar: 200 μm. e Kymograph of the density along the line indicated in a. f–i Density profiles along the same line corresponding to a–d. j Density as a function of time for the points indicated in g. Actin is labeled with Alexa-Fluor 488. Scale bars: 500 μm (a–e). Time scale bar: 1 min (e). Drop volume is 1.1 μL, chamber height h = 140 μm, and initial gel radius of short and long axis: R = 1.2 and 2.1 mm

