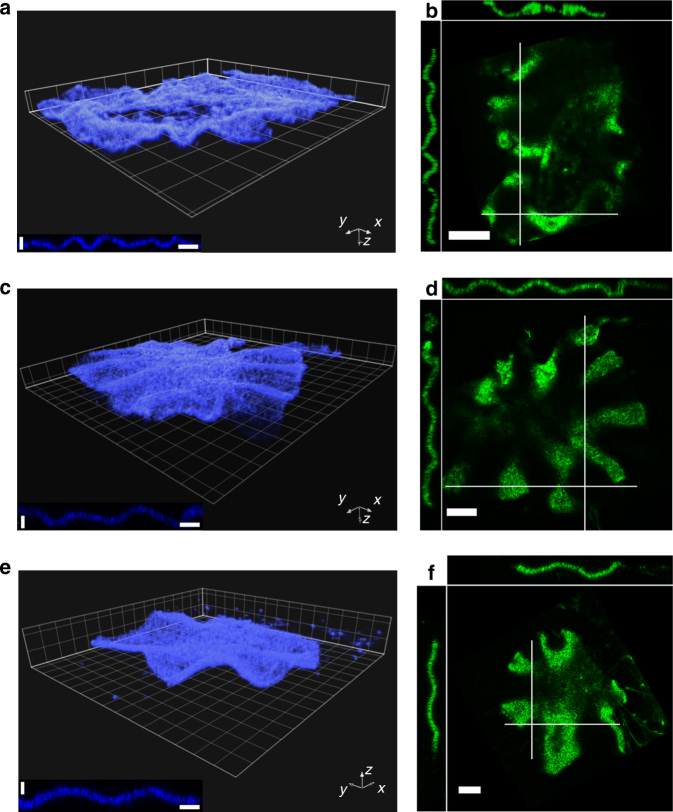
Fig. 6.
Buckled gels of different thicknesses. a Three-dimensional reconstruction of a gel with final sheet thickness b = 17 ± 2.5 μm (mean ± SD) from laser scanning confocal fluorescence micrographs. Errors for b indicate standard deviation of experimental values of the final gel thickness measured at Nthicknesses = 93 different places across the gel surface (Methods). b Laser scanning confocal fluorescence micrographs of the actin gel in a in the xy plane (top view), the xz plane (top side view), and yz plane (left side view). Side views (xz and yz planes) are measured along the white lines. c, d as in a, b but for a gel with b = 27 ± 3 μm (mean ± SD, Nthicknesses = 32). e, f as in a, b, but for a gel with b = 41 ± 2.5 μm (mean ± SD, Nthicknesses = 34). Chamber heights h: 73 μm (a, b), 100 μm (c, d), and 149 μm (e, f). Initial gel radius R and drop volume: 3.4 mm and 2.6 μL (a, b), 3.25 mm and 3.3 μL (c, d), and 3.73 mm and 6.5 μL (e, f). Scale bars: 100 μm (horizontal) and 60 μm (vertical) (insets of a, c, e) and 200 μm (b, d, f). Grid mesh size is 100 μm (a, c, e)

