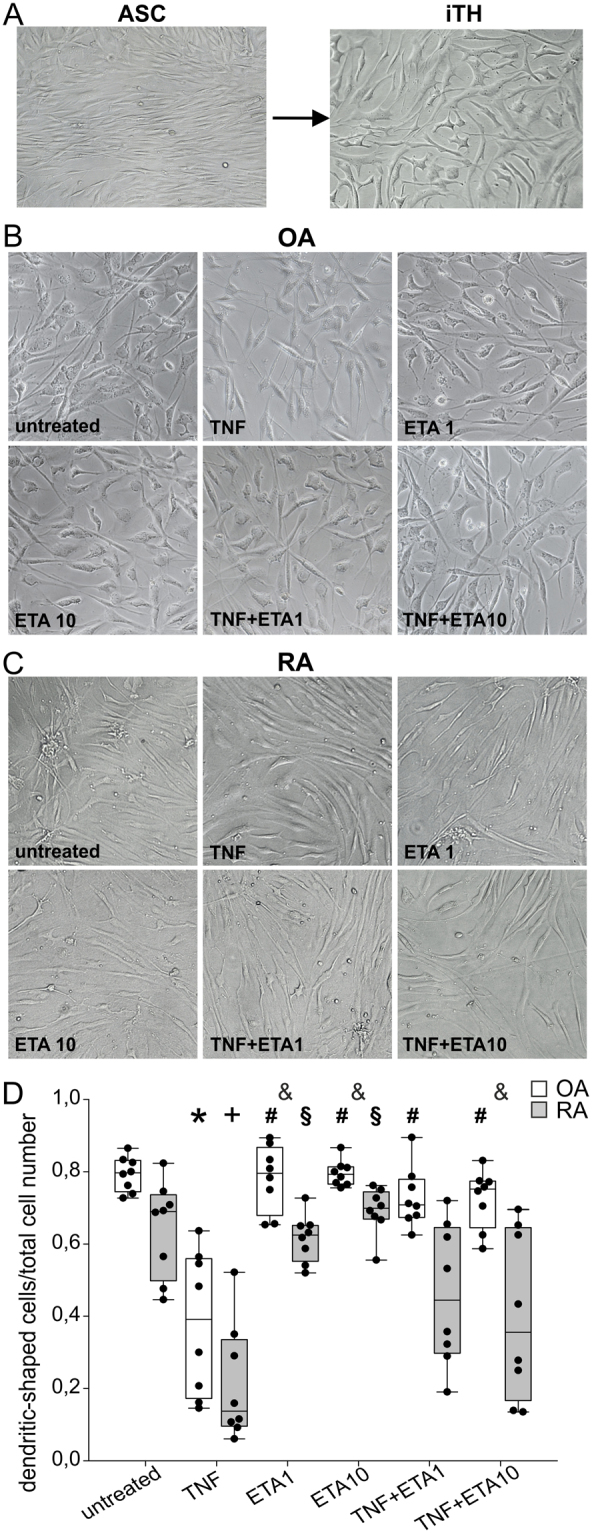
Figure 2.

Morphology of generated iTH+ cells. (A) Change of fibroblast-like morphology of synovial adipose tissue-derived stem cells (sASC) to neuron-like morphology after 12 days of catecholaminergic differentiation (representative image of OA donor cells of one patient, magnification 200x). (B) Light microscopic appearance of OA iTHs after treatment with different concentrations and combinations of 10 ng/ml TNF and 1 or 10 µg/ml etanercept (ETA) (magnification 200x). (C) Light microscopic appearance of RA iTHs after treatment with same agents as in B (magnification 200x). (D) Number of fully differentiated dendritic-shaped cells after 12 days of catecholaminergic differentiation demonstrated as ratio of dendritic-shaped cells to total cell count (n = 8). Data are presented as box plots with the 10th, 25th, 50th (median), 75th, and 90th percentiles. Each black circle represents an individual patient sample. Significant p-values (p ≤ 0.05) against OA control are presented as “*”; against OA TNF group as “#”; against RA control as “+”; against RA TNF group as “§”; and differences between respective OA and RA groups as “&”. Abbreviations: TNF10 = TNF 10 ng/ml; TNF1 = TNF 1 ng/ml; ETA1 = Etanercept 1 µg/ml; ETA10 = Etanercept 10 µg/ml.
