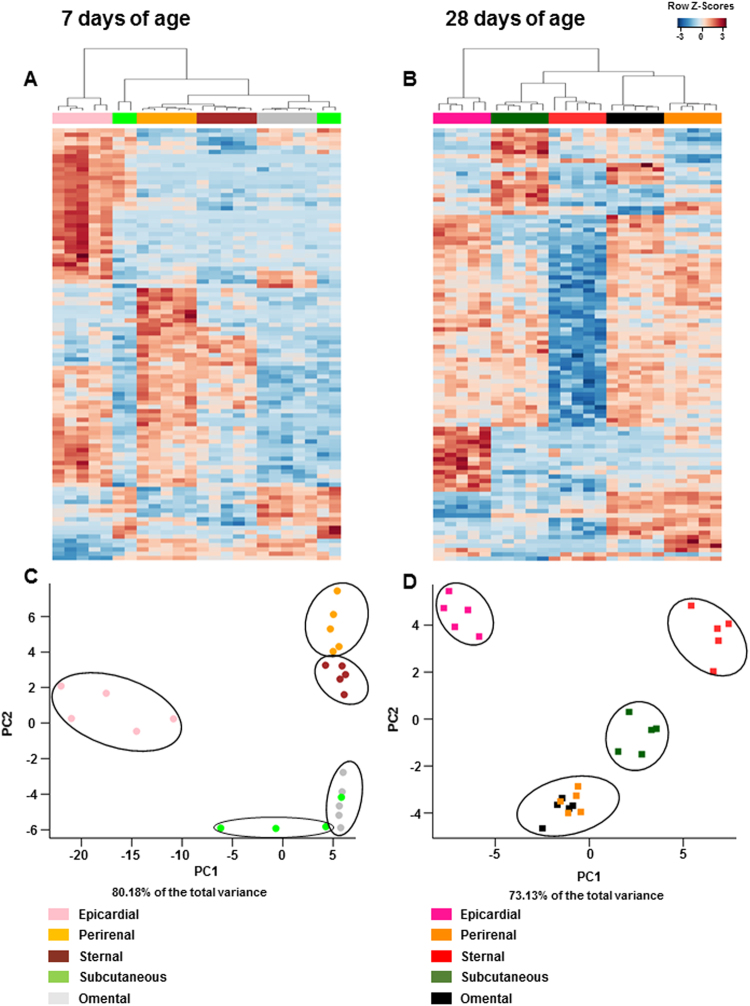
Figure 2.
Comparison in gene expression of five adipose tissue depots at (A) 7 and (B) 28 days of age. Heat map and unsupervised hierarchical clustering dendrograms are shown for the top 100 differentially-expressed gene transcript comparisons identified by microarray analysis (average linkage, Euclidean distance metric) as selected by eBayes moderated t-statistics (FDR < 0.05). Gene expression was transformed to a Z-score, and blue represents a relative is a decrease and red an increase in gene expression between each depot at the same age. Principal component analysis (PCA) of gene expression data from five different adipose tissue depots from each animal was performed using 10055 data sets that passed the variance test QC at (C) 7 and (D) 28 days of age. Each sample is represented by a sphere (7 days) or rectangle (28 days) and color-coded to indicate the age and tissue to which it belongs.

