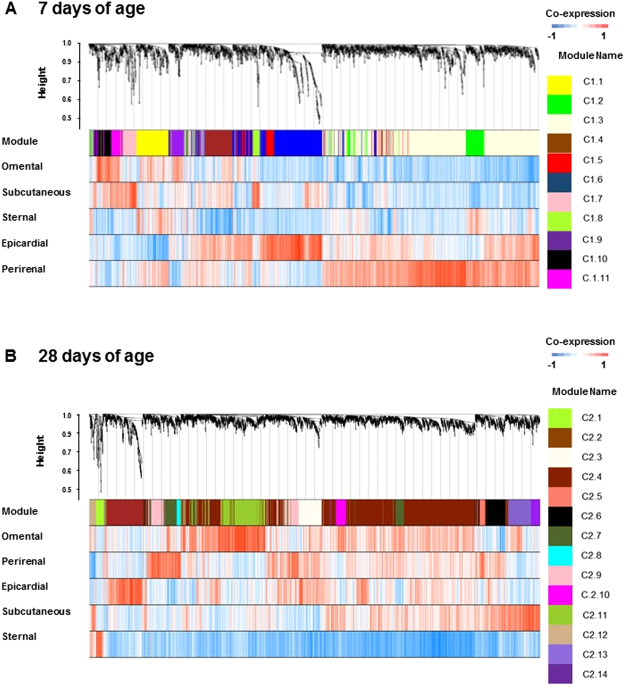
Figure 3.
Co-expression dendrogram analysis from the five adipose tissue depots sampled at either (A) 7 or (B) 28 days of age. In each dendrogram, the first row is subdivided into co-expressed modules founded in each age group. Rows 2 to 6 show the differential expression relationships between module genes and the adipose depot. The relationship of each gene with the assigned module is colour coded from blue (negative co-expression) to red (positive co-expression).

