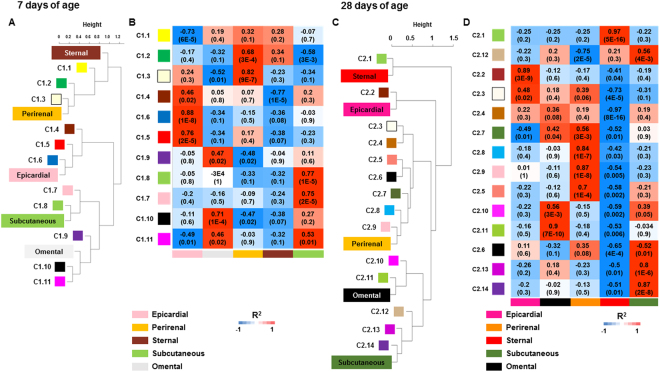
Figure 4.
Summary of adipose tissue depot- and age-specific functional organisation of modules within each gene network. They were related individually by their first principal component, referred to as the module eigengene (ME). Each dendrogram illustrates the modules of co-expressed genes and their positive alignment within the ME at (A) 7 and (C) 28 days of age. The height (X-axis) indicates the magnitude of correlation expressed as Euclidean distances. Heat maps represent the correlation (and corresponding p-values) between co-expressed modules for each fat depot at (B) 7 and (D) 28 days of age. The colour scheme, from blue to red, indicates the magnitude of correlation, from low to high. Regional-specific modules identified as being highly correlated (i.e. over-expressed) for each adipose depot are shown in the columns.

