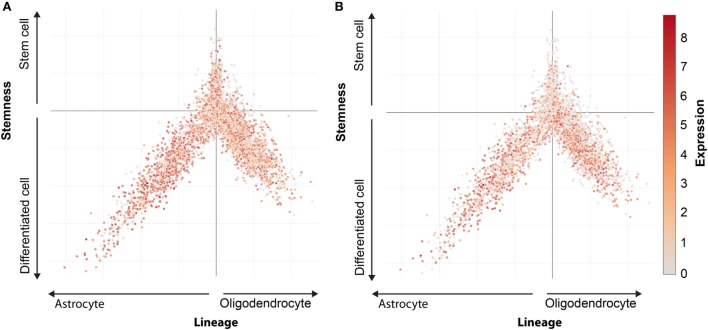
Figure 3.
HLA expression in oligodendroglioma. Expression pattern of HLA-A (A) and HLA-B (B) in oligodendrocytes, astrocytes, and cancer stem cells. Every dot represents a single cells. Oligodendrocytes lineage (positive X, negative Y), astrocytes lineage (negative X, negative Y), and stem cells (positive Y). Expression level indicated by colors from gray (low expression) to red (high expression).

