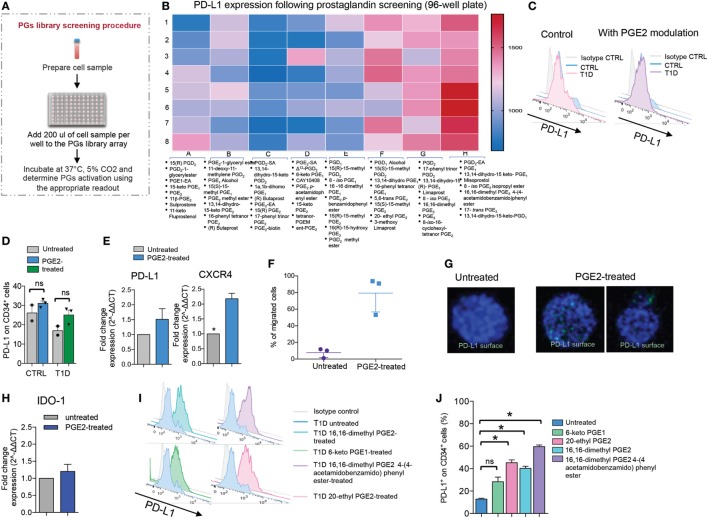
Figure 2.
Prostaglandins (PGs) enhance PD-L1 expression on human CD34+ cells. (A,B) Results of screening of a PG small molecule library tested for the ability to upregulate PD-L1 (MFI) on CD34+ cells obtained from T1D patients. The schematic of the experimental design is shown in (A). The 3-color coding shown in (B) represents lowest PD-L1 MFI values (blue), median PD-L1 MFI values (pink), and highest PD-L1 MFI values (red). (C,D) Representative flow cytometric analysis and quantitative bar graph of PD-L1 expression on CD34+ cells from T1D patients pre- and post-pharmacologic modulation with PGE2 as compared to CD34+ cells obtained from healthy controls. (E) PD-L1 and CXCR4 expression (mRNA) fold change was quantified for CD34+ cells pre- and post-modulation with PGE2. (F) Migration assay using CD34+ cells pre- and post-modulation with PGE2. (G) Confocal imaging of CD34+ cells pre- and post-modulation with PGE2, showing DAPI (in blue) and PD-L1 (in green) staining. 63× magnification. Scale bar, 50 µm. (H) IDO-1 expression (mRNA) fold change was quantified for CD34+ cells pre- and post-modulation with PGE2. (I,J) Representative flow cytometric analysis (I) and quantitative bar graph (J) of PD-L1 expression on CD34+ cells from T1D patients pre- and post-pharmacologic modulation with four small molecule PGE2 agonists. All data are expressed as mean ± SEM. *P < 0.05, **P < 0.001. Abbreviations: MFI, mean fluorescence intensity; T1D, type 1 diabetes; PGE2, prostaglandin E2.

