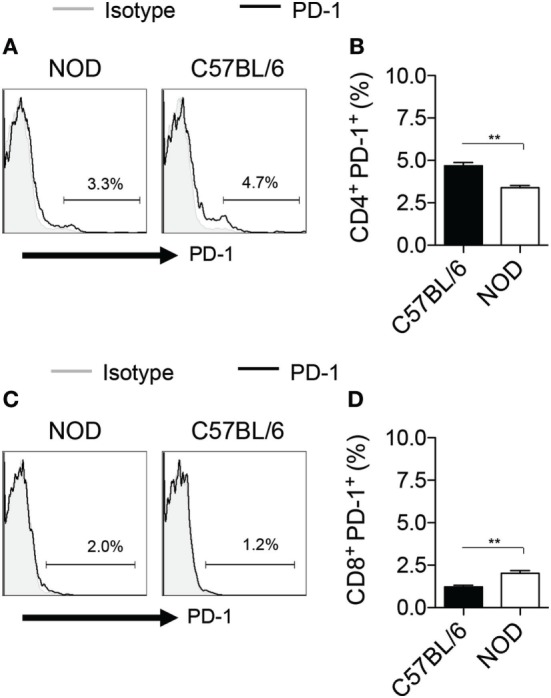
Figure 5.

PD-1 expression on murine T cells. (A,B) Representative flow cytometric analysis (A) and quantitative bar graph (B) for PD-1+CD4+ T cells isolated from splenocytes of NOD mice as compared those from C57BL/6 mice. (C,D) Representative flow cytometric analysis (C) and quantitative bar graph (D) for PD-1+CD8+ T cells isolated from splenocytes of NOD mice as compared those from C57BL/6 mice.
