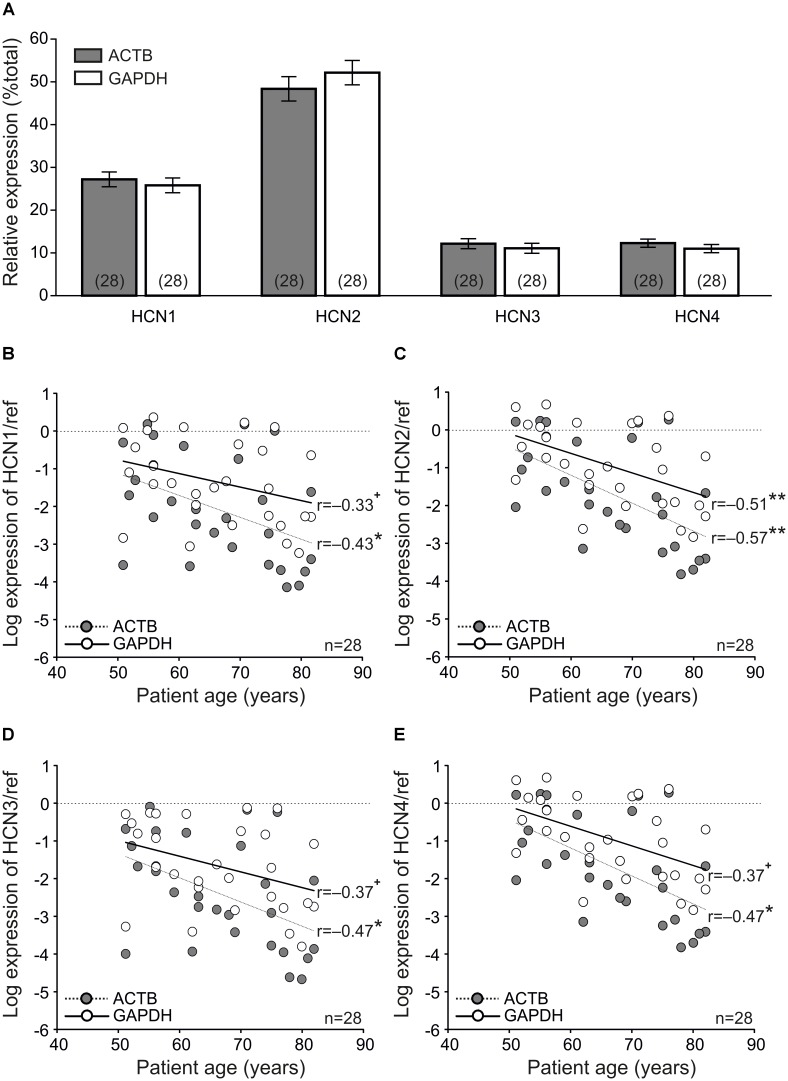
FIGURE 3.
Quantitative PCR indicates age-dependent down-regulation of HCN channels. (A) Relative expression of HCN channel isoforms indicating that HCN2 is the predominant isoform on the transcriptional level. (B–E) Scatter plots showing the mRNA expression of HCN1-4 relative to the reference genes ACTB (gray symbols) and GAPDH (open symbols). Note the high concordance of relative expression values using both reference genes ( +P < 0.1, paired t-test; ∗P < 0.05, paired t-test; ∗∗P < 0.01, paired t-test).

