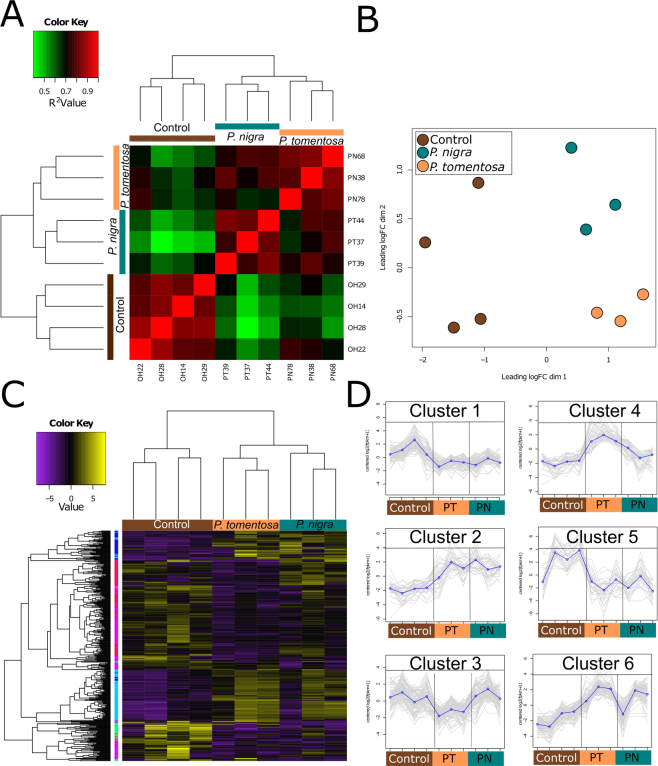
Figure 1.
RNA-Seq Profiles of Guts of Third Instar A. glabripennis Feeding on Acer spp., P. nigra, or P. tomentosa. (A) Pearson’s Correlation Analysis of RNA-Seq Profiles from A. glabripennis Guts. Pearson’s correlation analysis of Euclidean dissimilarities of RNA-Seq profiles from beetles feeding in three substrates was performed using the ‘cor’ command in R85. Red represents high correlations (0.8 and above) while green represent low correlations (0.7 and below). n = 4 for Acer spp (control), n = 3 for P. tomentosa, and n = 3 for P. nigra. (B) NMDS Analysis of RNA-Seq Profiles from A. glabripennis Guts. NMDS analysis was conducted using the plotMDS.dge command in edgeR86. Prior to analysis, values were log2 transformed, z-score standardized, and genes with less than one count per million in at least three samples were removed from the count matrix. (C) Heatmap Analysis of Differentially Expressed Genes in Guts of A. glabripennis. Differentially expressed genes were identified using edgeR86 with an FDR ≤ 0.05 and a fold-change cutoff of ±2. Prior to heatmap analysis, values were log2 transformed and z-score standardized. Cluster analysis of samples and genes was performed based on Euclidean dissimilarities using the complete linkage method and the heatmap was prepared using the heatmap.3 package in R85. Purple indicates low expression, yellow indicates high expression, and sidebar indicates clusters of genes with similar expression profiles based on a k-means analysis. (D) Major Expression Profiles of Differentially Expressed Genes. A k-means analysis was used to identify six groups of genes that showed similar expression patterns across the three treatments. Cluster one represents genes downregulated in both poplar species (n = 110 genes) while cluster two represents genes upregulated in both poplar treatments (n = 40) compared to controls. Clusters three (n = 100) and four (n = 45) represent genes down- and up-regulated specifically in the P. tomentosa treatment, respectively. Cluster five (n = 30) contains genes upregulated in most of the controls, with the exception of one, while Cluster six (n = 85) contains genes that were more highly expressed in all individuals feeding in poplar with the exception of one individual from the P. nigra treatment.

