
Graph 4.
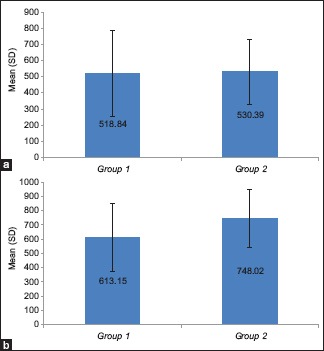
(a and b) Comparison of bone density in terms of mean (SD) in periapical region at different time intervals in the two groups using unpaired t-test. (a) 24 h (b) 3 months
Official websites use .gov
A
.gov website belongs to an official
government organization in the United States.
Secure .gov websites use HTTPS
A lock (
) or https:// means you've safely
connected to the .gov website. Share sensitive
information only on official, secure websites.
(a and b) Comparison of bone density in terms of mean (SD) in periapical region at different time intervals in the two groups using unpaired t-test. (a) 24 h (b) 3 months