Table 3b.
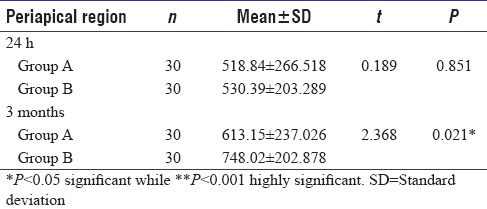
Comparison of bone density in terms of mean±stanard deviation in periapical region at different time intervals in the two groups using unpaired t-test

Comparison of bone density in terms of mean±stanard deviation in periapical region at different time intervals in the two groups using unpaired t-test
