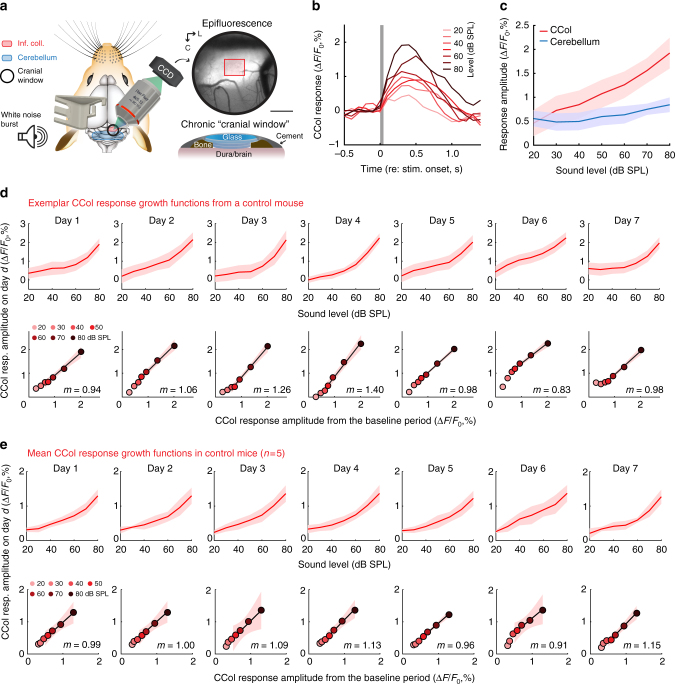
Fig. 2.
Sound-evoked corticocollicular axon response increases monotonically with sound level and remains stable over 1 week of imaging. a A chronic preparation for epifluorescence imaging of GCaMP6s in CCol axons via a cranial window (scale bars = 0.5 mm) in awake, head-fixed mice. Red rectangle denotes region of interest for CCol imaging. L is lateral and C is caudal. Mouse schematics in Figs. 2a, 3a, and 4a are adapted with permission from Aronoff et al., 201069. All rights reserved. These images are not covered under the CC BY license for this article. Scientific data and content are original. b Time course of mean fractional change in the CCol response amplitude evoked by a 50 ms white noise burst from a single imaging session. Gray box denotes stimulus timing and duration. c The monotonic growth of CCol peak response amplitude falls off steeply when the region of interest is shifted away from the IC. Data represent mean ± SEM. d Top: CCol response growth functions from a single mouse across seven daily imaging sessions. Data represent mean ± SEM. Bottom: Scatterplots depict the mean CCol response amplitude (x-axis) at each sound level measured from the first two imaging sessions (defined as baseline) against the CCol response amplitude (y-axis) measured on the day specified. The slope (m) of the linear fit provides an estimate of daily changes in response gain, where m = 1 indicates a matched response growth relative to baseline, m < 1 indicates a divisive flattening of the growth function and m > 1 indicates a multiplicative enhancement relative to baseline. Shading represents the 95% confidence interval of the fit. e As per d, averaged across all control mice (n = 5)

