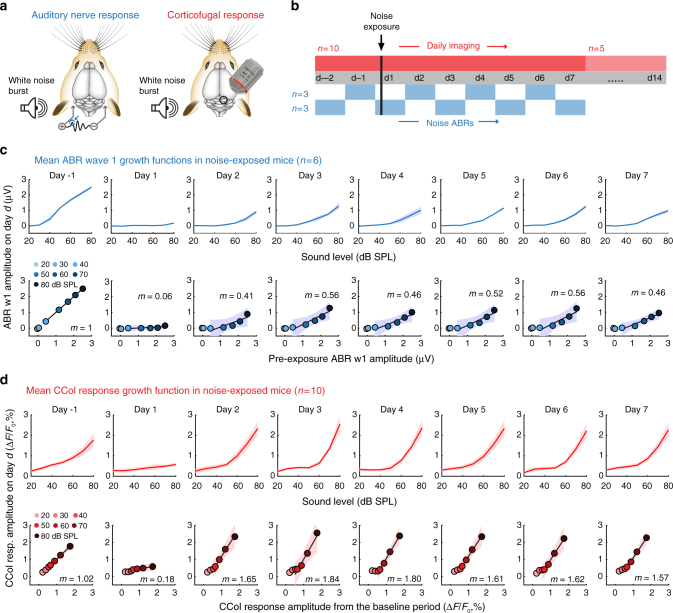
Fig. 4.
Opposing changes in auditory nerve and corticocollicular response growth functions following cochlear synaptopathy. a Auditory nerve growth functions were measured under anesthesia every other day according to the change in ABR wave 1 (blue circle) amplitude to white noise bursts of varying level (n = 6). CCol response growth functions were measured daily in a separate cohort of awake mice (n = 10) also using white noise bursts, per previous figures. b ABR wave 1 and CCol responses were both measured for 2 days (d) prior to moderate noise exposure and for 7 days following noise exposure. In a subset of noise-exposed mice (n = 5), CCol imaging was extended for an additional week after noise exposure. c, d As per Fig. 2e, ABR wave 1 (c) and CCol response (d) growth functions (top rows) and scatterplots of linear fits for baseline vs post-exposure growth functions (bottom rows) are provided for all mice. Data represent mean ± SEM. Linear fits of the five highest sound levels are illustrated by the solid black line with corresponding slope (m) and 95% confidence interval (blue and red shading)

