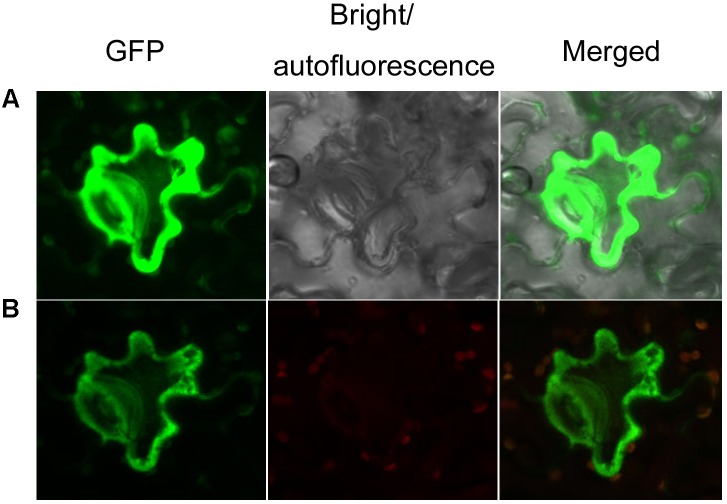
FIGURE 4.
Subcellular localization of AaCAD-EGFP. (A) The green fluorescence signal of GFP in cells is shown in images photographed using green and bright channels. (B) The green fluorescence signal of GFP in cells is shown in images photographed using green and red channels. Green, green fluorescence of GFP; red, autofluorescence of chloroplasts; merged, green fluorescence of GFP and red autofluorescence of chloroplasts. This experiment was repeated three times, each with at least three biological replicates.

