FIGURE 6.
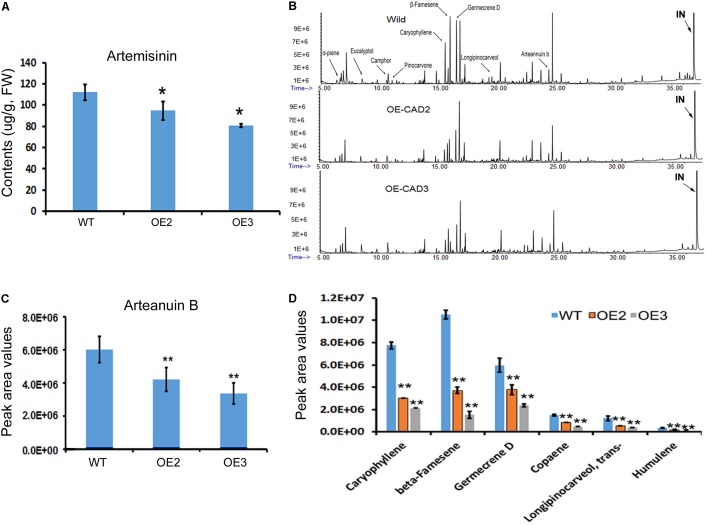
Effects of AaCAD overexpression on levels of artemisinin, arteannuin B, and other sesquiterpenes in leaves of transgenic plants. (A) LC-MS analysis measurements show decreases in artemisinin contents. (B) Overlay of total ion chromatographs shows the abundance reduction of numerous non-polar metabolites, among which arteannuin B and sesquiterpenes are labeled as follows: “IN”, internal metabolite as a control. (C) Peak area values show the significant reduction of arteannuin B. (D) Peak area values show the reduction of five sesquiterpenes. ∗ in (A) and ∗∗ in (C) and (D) denote a significant difference in the transgenic lines compared with WT plants. (N = 3, p < 0.01). All experiments were carried out with three biological replicates, each with three replicates.

