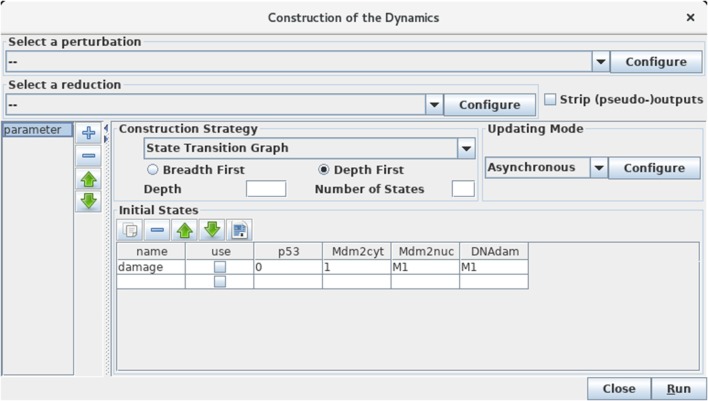
Figure 5.
Launching of the construction of a state transition graph. This panel is obtained when selecting Run Simulation from the Tools scrolling menu in GINsim main window. The default simulation settings are shown, i.e., the construction of a state transition graph using the asynchronous updating, with no specified initial state (meaning that all states are considered in the simulation). Hitting the Run button will generate the corresponding state transition graph, which can be displayed in a new window (see Figure 6). In the table under Initial States, one can define one or several initial states from which the dynamics will be constructed (just type the desired values in a row along with an optional name). Each row of the table defines a single pattern of states, and the check-boxes allow to select the states to be used for a simulation. The levels are specified for each node in the corresponding table cell. Nodes for which values are left free are denoted by stars (*). Initial states can be reordered, deleted and duplicated using the buttons just above the table. Here, a unique initial state has been defined, but not selected for simulation: the state 0111 (i.e., with p53 set to 0, and the three other nodes set to 1). Note that M1 emphasizes the fact that the value 1 is the maximal level for Mdm2nuc and for DNAdam. Several parameter configurations can be created and stored using the + button on the left side.

