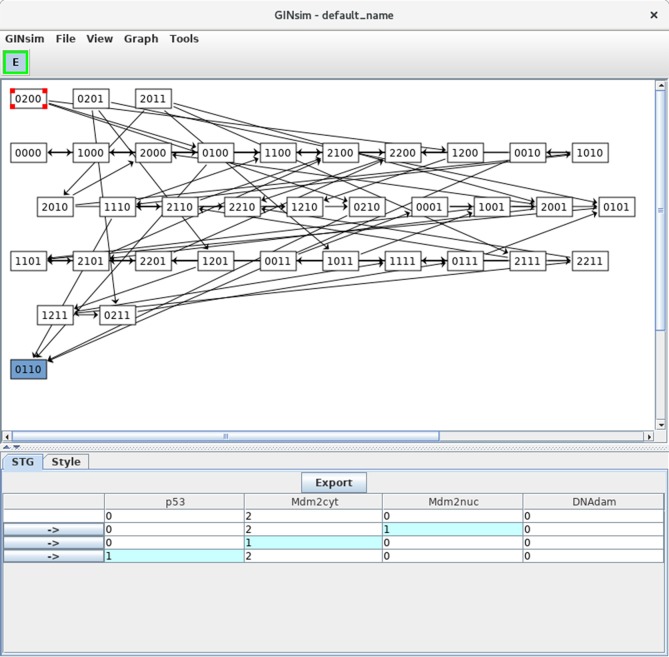
Figure 6.
Asynchronous state transition graph for the p53-Mdm2 model. This STG has been generated with the simulation parameters shown in Figure 5. The unique stable state 0110 lays at the bottom. The selected state 0200 is shown in the STG tab, with its successors.

