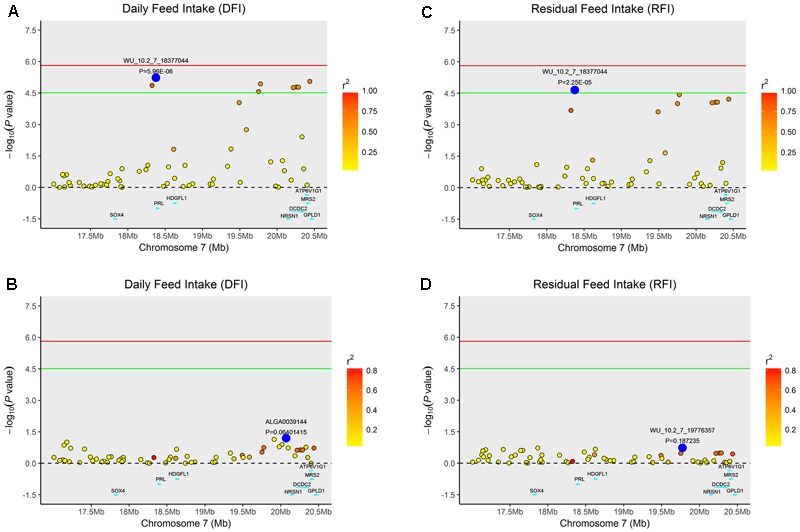
FIGURE 2.

Regional association plot of the primary signal (WU_10.2_7_18377044) associated with DFI and RFI at SSC7. For each plot, negative log10 P-values of SNPs (y-axis) are presented according to their chromosomal positions (x-axis). The red line and green line indicate the genome-wide significance level (P < 1.54E-06) and the suggestive level (P < 3.08E-05), respectively. The primary SNP are denoted by large blue circles. SNPs are represented by colored circles according to the target SNP with which they were in strongest LD. The left panel of the figure shows the association results for DFI (A) before and (B) after conditional analysis on WU_10.2_7_18377044. The right panel of the figure shows the association results for RFI (C) before and (D) after conditional analysis on WU_10.2_7_18377044. The P-value of association results for (B) DFI and (D) RFI after conditional analysis on WU_10.2_7_18377044 fell below the predicted threshold.
