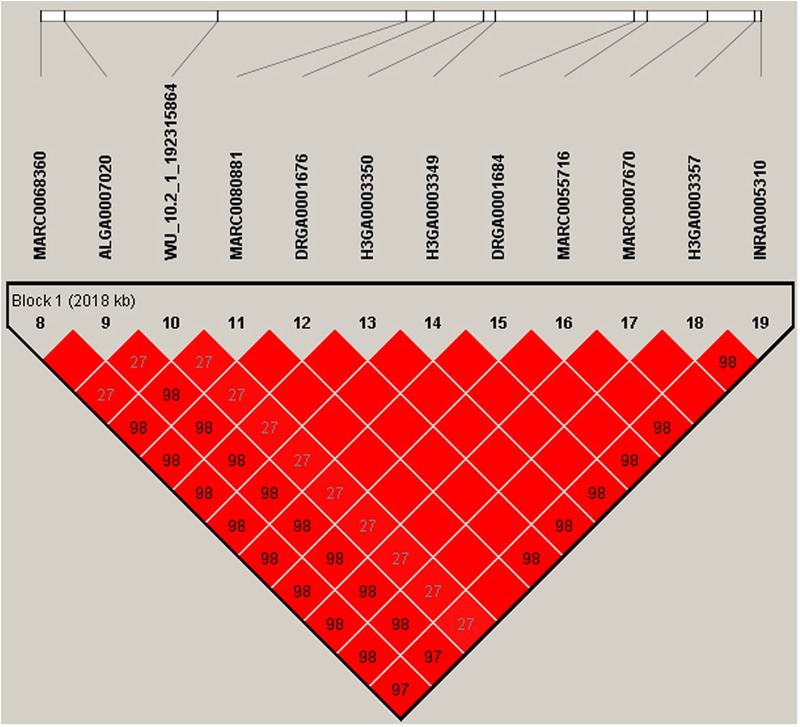
FIGURE 4.

The LD block in the significantly associated region on SSC1. LD blocks are marked with triangles. Values in boxes are LD (r2) between SNP pairs and the boxes are colored according to the standard Haploview color scheme: LOD > 2 and D′ = 1, red; LOD > 2 and D′ < 1, shades of pink/red; LOD < 2 and D′ = 1, blue; LOD < 2 and D′ < 1, white (LOD is the log of the likelihood odds ratio, a measure of confidence in the value of D′). Annotated genes in the chromosomal region retrieved from the Ensemble genome browser (www.ensembl.org/Sus_scrofa/Info/Index).
