Figure 2.
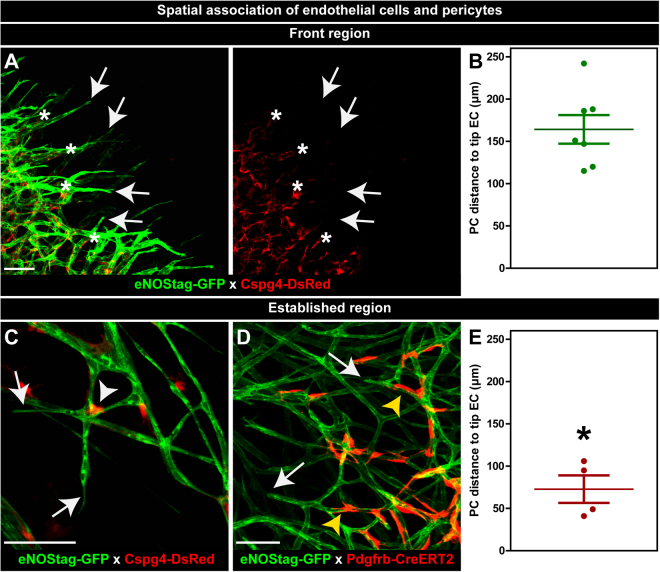
Spatial association of endothelial cells and pericytes. (A,B) Association in the angiogenic front region. (A) Endothelial tip cells (arrow) and pericytes (asterisk) association at the angiogenic front. (B) Quantification of pericyte – endothelial tip cell distance in the front region. (C–E) Association in the established region. (C,D) Close to the endothelial tip cell (arrow) pericytes are found in the branching points (white arrowhead) or around the tube (yellow arrow). (E) Quantification of pericyte – endothelial tip cell distance in the established vessel region. Data represents mean ± SEM. *p < 0.05 versus (B). Scale bars represent 100 µm.

