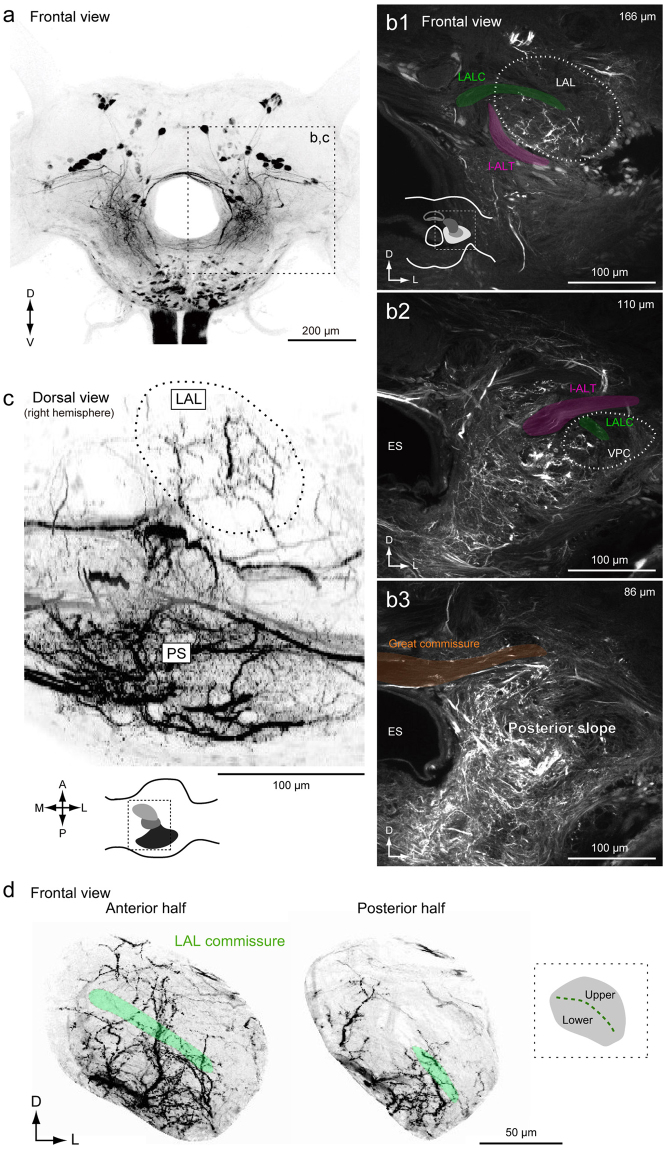
Figure 2.
Anatomical organization of descending and ascending neuron innervation in the brain. (a) Mass-staining results by backfilling from the neck connective on both sides. The positions of DN groups are shown on the right. G1, group-I DNs; G2, group-II DNs; G3, group-III DNs; GNG, DNs of gnathal ganglion. (b) Confocal stacks of mass-staining results in the protocerebrum. The depth from the posterior brain surface are shown in the top-right. Inset shows the schematic of the imaging area (b1). The LAL and VPC are shown with a broken line. The locations of major bundles are indicated by color: the lateral accessory lobe commissure (LALC, green), lateral antennal-lobe tract (l-ALT, magenta) and great commissure (GC, orange). (c) Dorsal view of innervation of descending and ascending neurons. Inset shows the imaging area. The LAL is shown with a broken line. The innervation in the PS is more dense than in the LAL. (d) Neurite innervation in the LAL. The maximum intensity projection for the anterior and posterior half of the LAL are shown. The position of the LALC is indicated by green. Inset shows subdivisions within the LAL. The upper and lower divisions are roughly delineated by the LALC. Innervation is observed in both upper and lower divisions in the anterior part, but is largely confined to the lower division in the posterior part of the LAL.

