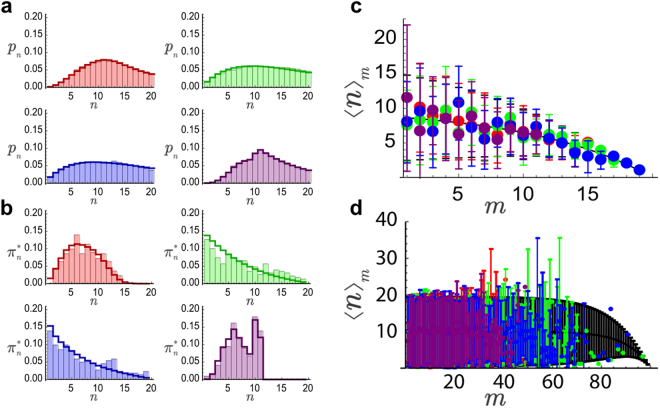
Figure 2.
Probabilities of cell size (a) and cell size-at-birth (b) as a function of the division pattern for the case α = 0.1 and N = 20. Bars: numerical simulations; Lines: exact stationary solution. Division pattern color code: red, green, blue, and purple stand for binomial, uniform, inverse binomial, and division by the middle respectively. Notice that some lengths cannot be reached if cells divided by the middle and that the uniform and inverse binomial division patterns leads to almost indistinguishable size statistics. The panels (c and d) show that the average increment is independent of the division pattern and that finite size effects are noticeable as long as m ~ N: (c) N = 20, (d) N = 100; symbols correspond to numerical simulations (same color code as in panels (a and b)) and the black line to the theoretical solution given by Eq. (10) (error bars stand for the standard deviation).

