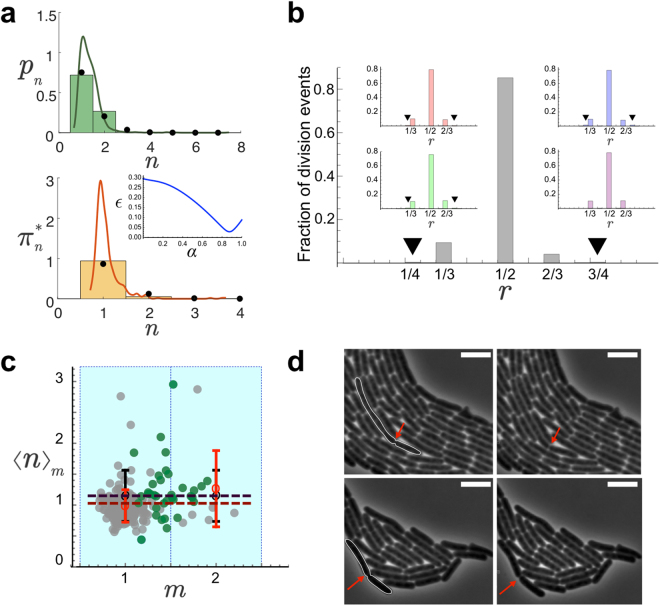
Figure 5.
(a) Stationary probabilities of cell sizes pn (top, 3297 single cell data points) and cell sizes at birth (bottom, 488 single cell data points) binned as a function of the state n (l0 units). The lines correspond to the unbinned, continuous, distributions ρ(l) (top) and ρ(lb) (bottom). The clustering process defines cell classes depending on the units l0 contained and allows to compare theoretical predictions and experimental results. By fitting simultaneously the experimental probabilities to the theoretical values (inset shows error minimization as a function of α) we estimated the value of the division efficiency, α = 0.87, when the division pattern considered was all septa to be equiprobable (binomial pattern of division): black circles. Alternative division patterns produce similar results (Fig. S7). (b) Fraction of division events as a function of the ratio, r, between mother and daughter cell sizes as obtained experimentally. The insets show the results of numerical simulations for different division patterns using the value of α as measured in experiments: red, green, blue, and purple stand for binomial, uniform, inverse binomial, and division by the middle respectively. The black triangles point out 1/4 and 3/4 division fractions, barely visible, that reveal the existence of cell sizes up to 4 unit lengths. All tested division patterns but the division by the middle show the 1/4 and 3/4 division ratios. (c) Size increment as a function of the length at birth (both in units of l0). Points stand for single cell data (252). Grey points (216) account for cells born from symmetric divisions. Green points (36, including one outlier at m = 4 not shown in the figure) indicate cells born from asymmetric divisions (~15% of the division events). Open red circles stand for binned experimental values, open black circles for numerical simulations using the values of l0 and α as experimentally measured. The black line corresponds to the theoretical estimate, Eq. (10) using N = 20 and α = 0.87. The red line corresponds to the fitting of the experimental binned points to the theoretical estimate 1/α: α = 1.0 ± 0.1. The error bars stand for the standard deviation. (d) Snapshots showing examples of asymmetric division events. Time runs from left to right. 5 μm scale bar in all cases. The outlined cells on the left divide and generate two cells satisfying 1/4–3/4 (top) and 1/3–2/3 (bottom) size relations. The red arrows indicate the location of the septa.

