Figure 3.
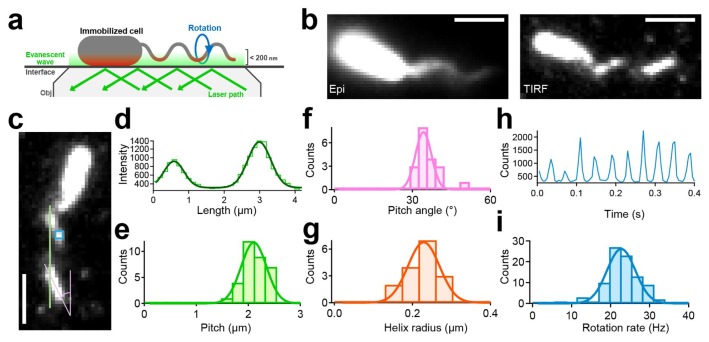
Quantification of the structural and functional parameters of archaellum under TIRFM (a) Schematics of the experimental setup. (b) Fluorescent micrograph taken by epi illumination (left) and TIRF illumination (right). Scale bars, 2 μm. (c) Fluorescent micrograph to explain how to measure the pitch, the helix angle, and the rotation rate. (d) An example of intensity profile of labeled archaella along the green line in c. (e) Histograms of the pitch. Histograms of pitches in archaella structures during CW rotation (n=33) Solid line represents the Gaussian fitting. The peak and SD were 2.11±0.24 μm. (f) Histograms of pitch angle (n=20). The peak and SD were 34±5°. (g) Histograms of helix radii (n=20). The peak and SDs were 0.24±0.04 μm. (h) The typical example of the intensity changes in a fixed area positioned on archaella as shown in c. (i) Histograms of rotation rate. The peak and SD were 22.5±4.5 Hz (n=109). The figure was reused with permission from Kinosita et al., 2016 with modifications.

