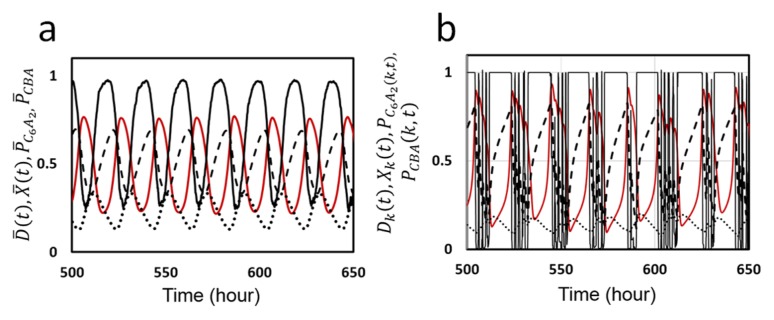
Figure 2.
Ensemble and single molecule oscillations in the KaiABC system simulated with the MM model. a) The ensemble oscillation of the phosphorylation level D̄ (t) (red line), structure of KaiC hexamer X̄(t) (black real line), probability to form complex C6A2, P̄ C6A2 (dashed line), and probability to form complexes C6BiA2j, P̄ CBA (dotted line), are plotted as functions of time. Averaged over the ensemble of N = 1000 hexamers. b) The single molecule oscillation of phosphorylation level Dk(t) (red line), structure Xk(t) (black real line), PC6A2(k, t) (dashed line), PCBA(k, t) (dotted line) of a KaiC hexamer arbitrarily chosen from the ensemble are plotted as functions of time. Parameters in Table 1 were used.

