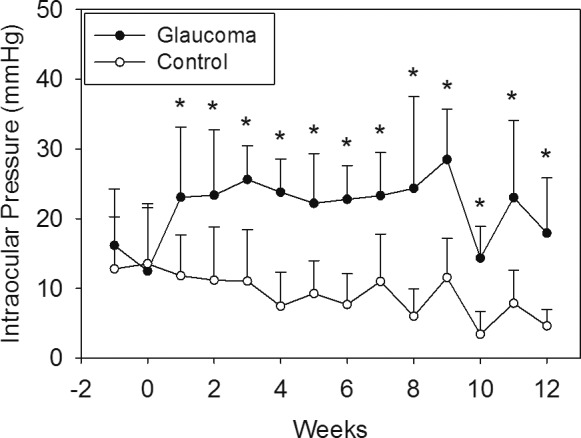
Figure 2.

Plot of the mean ± SD of IOP in the tree shrews' treated and control eyes. Time 0 is the day of bead injection. IOPs were similar between treatment groups at baseline (P = 0.43 and 0.82 at 1 week before and on the day of microinjections, respectively). There was an IOP versus time effect (repeated measures ANOVA, P < 0.001) and IOP was significantly elevated in the treated eye at every time point following treatment. (*P = 0.021 at week after injection and P < 0.01 at all other time points).
