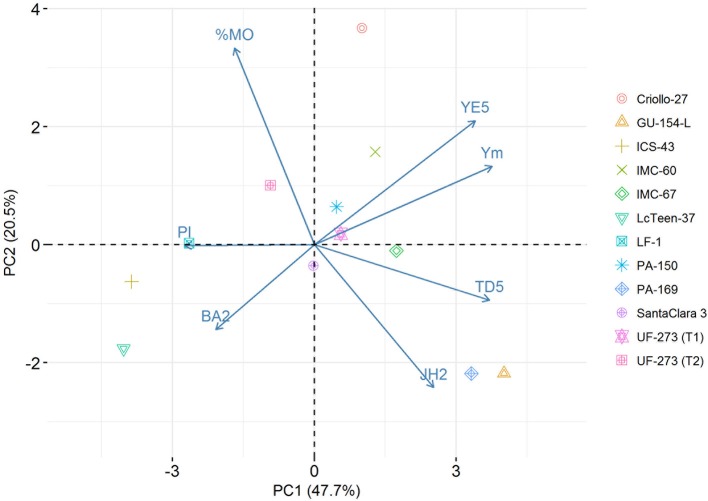
Figure 3.
Biplot of selected traits: proportion of Monilia infected pods (%MO), branch angle (BA2), Jorquette height (JH2), pod index (PI), trunk diameter at year five (TD5), yield efficiency at year five (YE5), mean yield ages 2–7 (Ym). The first two PCs of the predicted values for the L7 population account for 68.2% of the total variation. The scores of the parents are overlayed in the plot.

