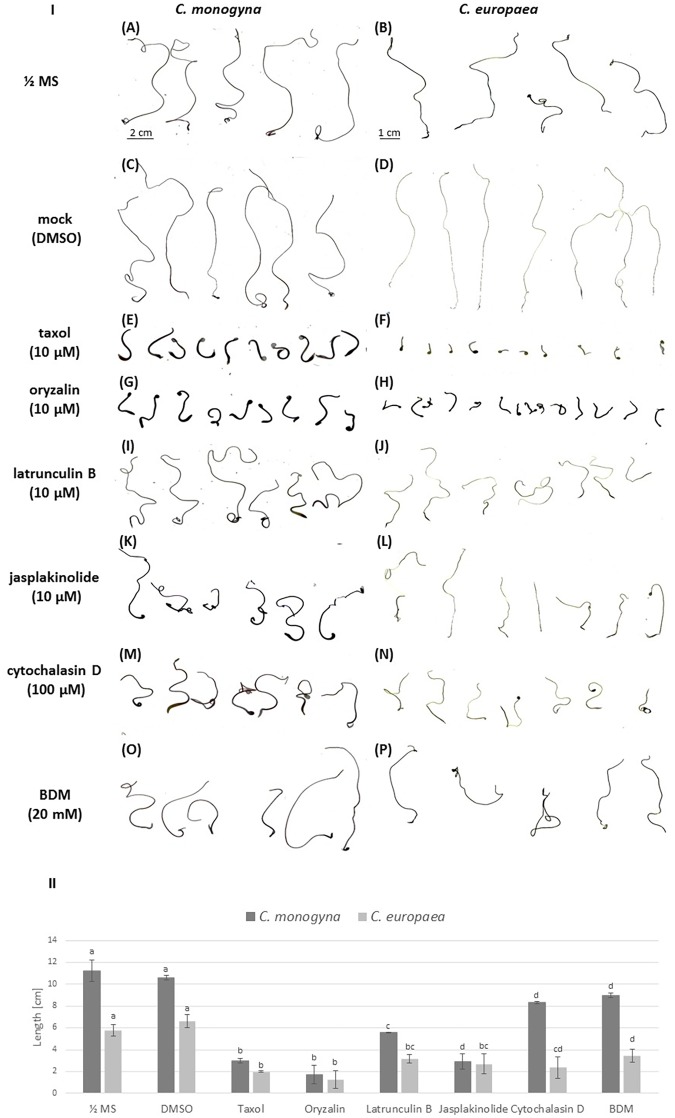
FIGURE 3.
(I) The inhibition of 7-day-old C. monogyna and C. europaea seedlings by cytoskeletal drugs: scanned seedlings of C. monogyna and C. europaea. (A,B) ½ MS medium; (C,D) mock control (0.001% DMSO in MS); (E,F) taxol (10 μM); (G,H) oryzalin (10 μM); (I,J) latrunculin B (10 μM); (K,L) jasplakinolide (10 μM); (M,N) cytochalasin D (100 μM); (O,P) BDM (20 mM). (II) Graphical presentation of seedling growth inhibition by cytoskeletal drugs. The lengths of the seedlings (n = 30 for each treatment, three biological repetitions) are presented as mean ± SE. The letter above the column indicates significant difference (Tukey HSD, P < 0.05).

