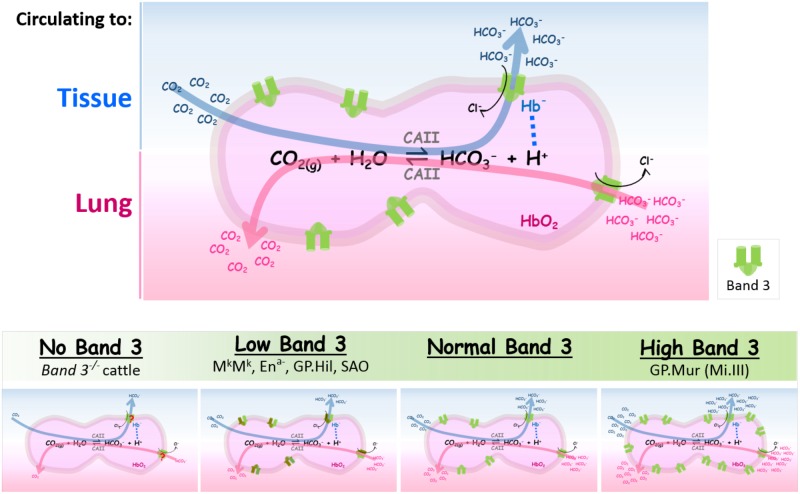
FIGURE 2.
The expression levels of band 3 are directly correlated with the efficiencies of blood CO2/HCO3— exchange. (Top) Intraerythrocytic CO2/HCO3— exchange in tissues or in lung alveoli is summarized in the reversible chemical reaction catalyzed by CAII [CO2(g) + H2O ⇌ HCO3—(aq) + H+(aq)]. When RBCs circulate to systemic capillaries, tissue metabolite CO2 enters RBCs to be converted into HCO3— by intraerythrocytic CAII. HCO3—, one of the two products from this forward reaction, exits from RBCs through band 3 (shown by the blue arrow which indicates the direction of the reaction in tissues). The direction of the counterion Cl— flux through band 3 is indicated by a black arrow. Proton, the other product generated by the forward reaction, is absorbed by deoxy Hb— that is transiently associated with band 3 (shown by a dotted line connecting Hb— and H+). When RBCs circulate to the lungs, HCO3— rushes into RBCs to be converted into CO2 for expiration (shown by the pink arrow which indicates the reverse direction of the reaction). Band 3 is symbolized as the green dimeric gate. (Bottom) The spectrum of band 3 expression levels in RBCs is outlined in the shaded green bar; their differential impacts on blood CO2 transport are illustrated in the four cartoon diagrams below. The four bottom diagrams from left to right: (1) Absence of band 3 reduces much HCO3— transport across the RBC membrane, rendering CO2/HCO3— exchange to be very inefficient. (2) Low band 3 expression can be found in some band 3/GPA mutations that result in semi-dysfunctional band 3 transporters, as described in the section of “Low or no band 3 expression” (shown here by the brown/green gate symbols for “structurally abnormal band 3”). (3) Normal band 3 expression. (4) Higher band 3 expression in GP.Mur RBCs (shown by more green gates on the cell membrane) increases the efficiency as well as the capacity of intraerythrocytic CO2/HCO3— conversion and HCO3— transport across the RBC membrane. The different numbers of CO2/HCO3— in the bottom four diagrams represent schematically the different magnitudes of CO2/HCO3— fluxes (metabolic flows) that correspond to the different levels of band 3 expression on the red cell membrane; they do not reflect extracellular concentrations of CO2 and HCO3—.

