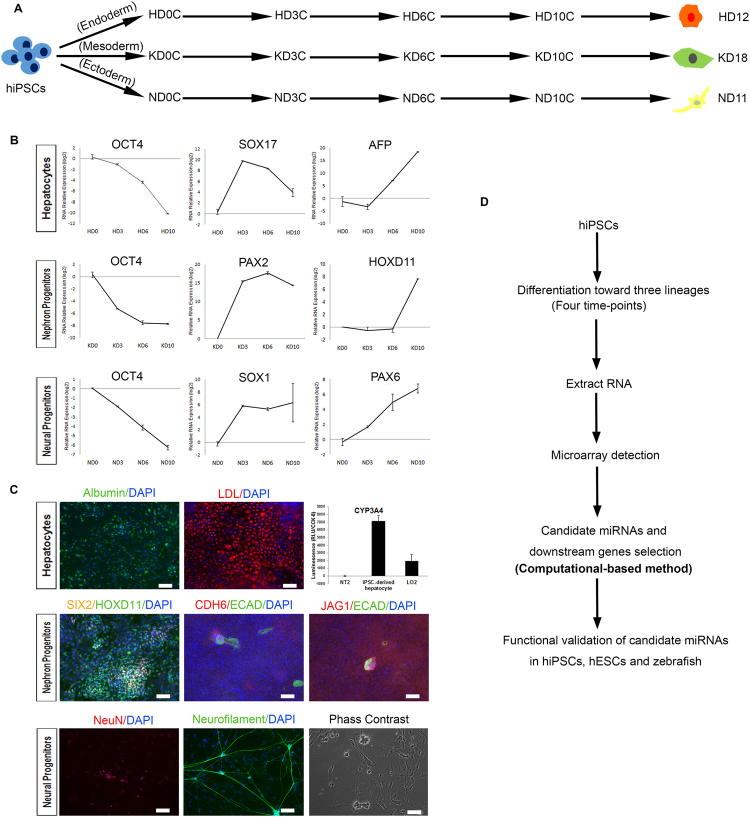
Figure 1.
Outline of the experimental design and summary of the multi-lineage induction. (A) Schematic overview of hiPSC differentiation into hepatocytes, nephron progenitors, and neural progenitors. (B) qPCR results showing the expression tendencies of pluripotency marker (OCT4), markers for endoderm (SOX17), mesoderm (PAX2), ectoderm (SOX1), and representative markers for hepatocytes (AFP), metanephric mesenchyme (HOXD11), and neural progenitors (PAX6) at four time-points. Values represent means ± SD (n = 2 independent cultures for each time-point). (C) Functional characterization of terminal cells, including hepatocytes (12 days), nephron progenitors (18 days) and neurons (40 days). For hepatocyte differentiation, Albumin (green fluorescence) indicates hepatocytes; LDL uptake assay indicates the LDL receptor activity in hepatocytes; and CYP450 assays show the cytochrome P450 activity of hepatocytes. For kidney differentiation, early metanephric mesenchyme marked by SIX2 (yellow fluorescence) and HOXD11 (green fluorescence), and nephron vesicles marked by CDH6 (green fluorescence), ECAD (red fluorescence) and JAG1 (red fluorescence) were induced successfully. For neuron differentiation, the nucleus and the axons of neurons were marked by NeuN (red fluorescence) and Neurofilament (green fluorescence), respectively. Phase contrast imaging showing the morphology of an induced neuron. Scale bars represent 100 μm. (D) Schematic overview of the experimental design. HD: hepatocyte differentiation; KD: nephron progenitor differentiation; ND: neural progenitor differentiation.

