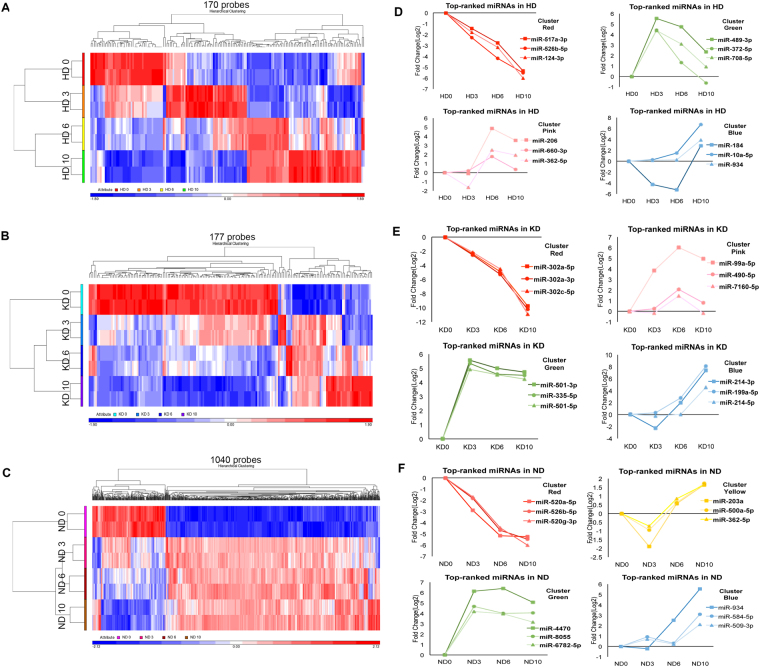
Figure 2.
Intra-lineage analysis of differentially expressed miRNAs. (A–C) Hierarchical clustering of 170 differentially expressed small RNAs in the first ten days of HD, 177 differentially expressed small RNAs of KD, and 1,040 differentially expressed small RNAs of ND, respectively. The values of two biological replicates (indicated in color) for each time-point are shown. (D–F) The miRNAs with differential dynamics changes were plotted in different colors: small RNAs that decreased with differentiation (red); small RNAs enriched in stage 1 and 4 but downregulated at stage 2 (yellow); small RNAs increased at stage 2 but decreased at later stages (green); small RNAs enriched in stage 3 (pink); and small RNAs only increased at the latest stage (blue).

