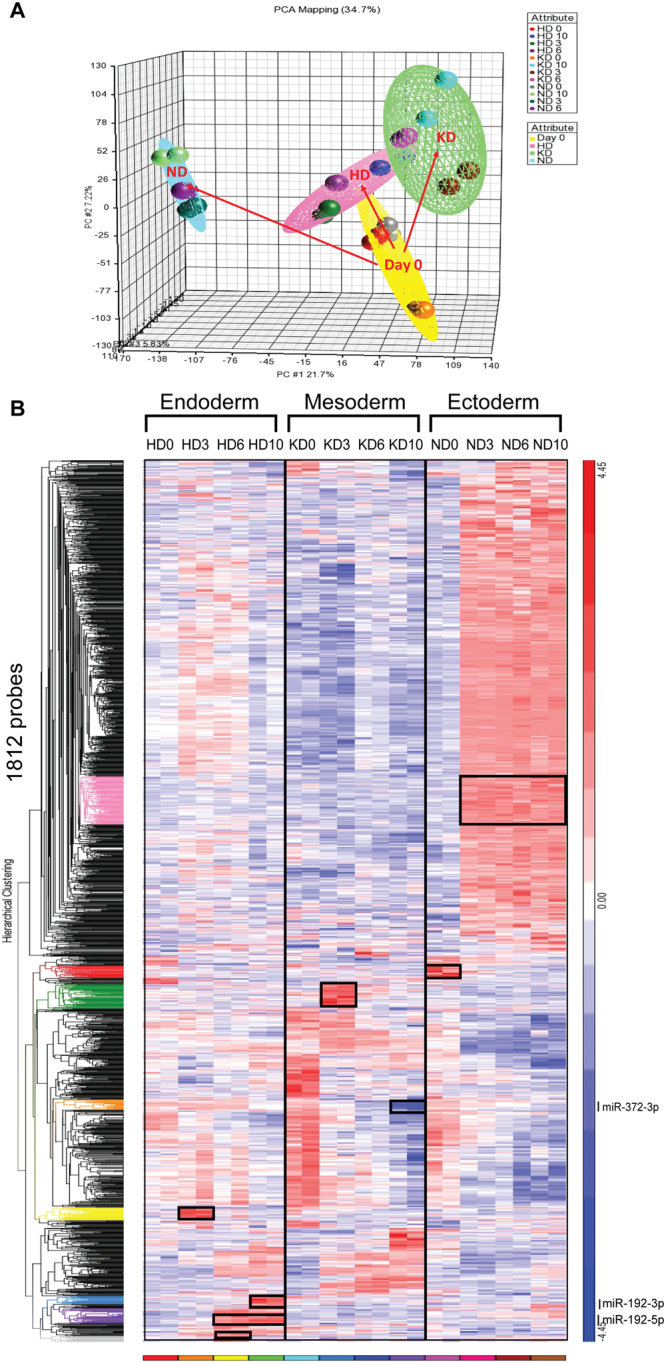
Figure 3.

Inter-lineage analysis reveals lineage-specific miRNAs. (A) Principal component analysis (PCA) showing the unsupervised division of samples into a day 0 group (yellow sphere), an HD group (pink sphere), a KD group (green sphere) and a ND group (blue sphere). (B) Comprehensive heat map showing distinct dynamics of small RNA expression patterns during lineage specification. Colored dendrograms and black boxes indicate small RNAs that were only upregulated or downregulated in one lineage. Particularly, gray, purple, blue and yellow dendrograms indicate small RNAs that were only changed in HD. Orange and green dendrograms indicate small RNAs that were only changed in KD, Red and pink dendrograms indicate small RNAs that were only changed in ND. The newly identified key miRNAs (miR-192-3p/5p and miR-372-3p) are indicated in the dendrograms that they are included.
