Figure 5.
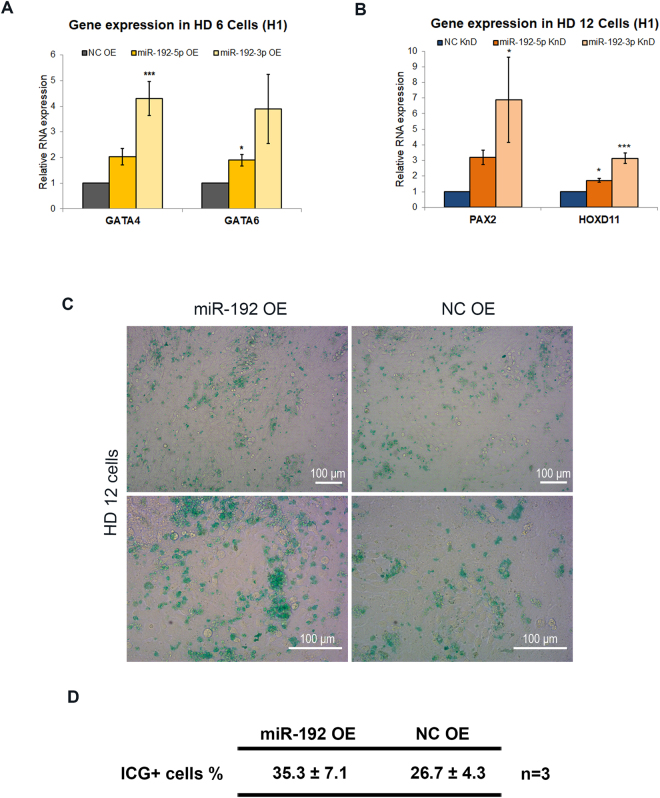
Regulation of lineage-specific gene expression by lineage-specific miRNAs during hepatocyte differentiation. (A) qPCR results showing the expression of definitive endoderm markers GATA4 and GATA6 in HD 6 cells with transfection of miR-192-3p/5p mimics (n = 3 independent cultures for each group). (B) qPCR results showing the expression of intermediate mesoderm marker PAX2 and metanephric mesenchyme marker HOXD11 in HD 12 cells upon transfection of miR-192-3p/5p inhibitors (n = 3 independent cultures for each group). (C) HD 12 cells were examined by indocyanine green staining (ICG). The cells transfected with miR-192 mimics (left column) and scramble controls (right column) were compared (Scale bars represent 100 μm). (D) Table showing the percentage of ICG+ cells at HD 12 with the transfection of miR-192 mimics and non-targeting controls (data are presented as the means ± SD. n = 3 independent cultures for each group). In (A,B), data are presented as the means ± SD. *P < 0.05, **P < 0.01, ***P < 0.001 for statistical comparisons between control groups and experimental groups (ANOVA plus Bonferroni’s post hoc test). OE: overexpression; KnD: Knockdown; NC: non-targeting control.

