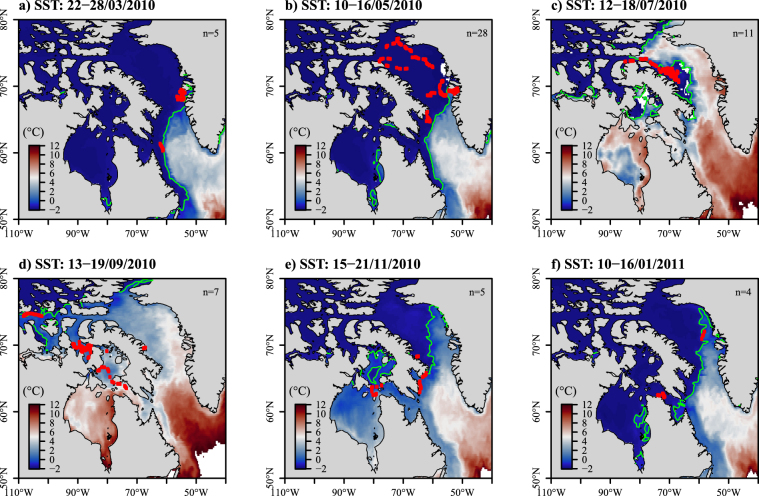
Figure 3.
Maps of the weekly averaged SST (in °C) derived from Copernicus in March (a), May (b), July (c), September (d), November (e) and January (f) 2010–2011. Positions of bowhead whales are indicated with red dots and the green lines stand for the −1 °C isotherm (freezing point). The number of tracked individuals per week is noted at the top right of each panel. Maps were generated using R software version 3.4.3. (R Core Team (2017). R: A language and environment for statistical computing. R Foundation for Statistical Computing, Vienna, Austria. http://www.R-project.org/).

