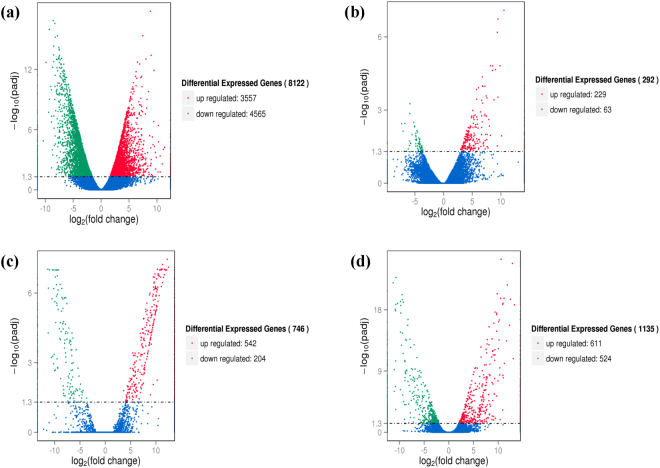
Figure 1.
Volcano plots for expressed genes in the four comparison groups. Volcano plots for all the expressed genes in (a) CDT vs. CD, (b) WDT vs. WD, (c) CD vs. WD, and (d) CDT vs. WDT. X- and Y-axis present the log2(ratio) for the two samples and −log10(padj), respectively. Red (Up regulated) and green (down regulated) dots mean that the genes have significant difference, while the blue dots correspond to genes with no significant differences.

