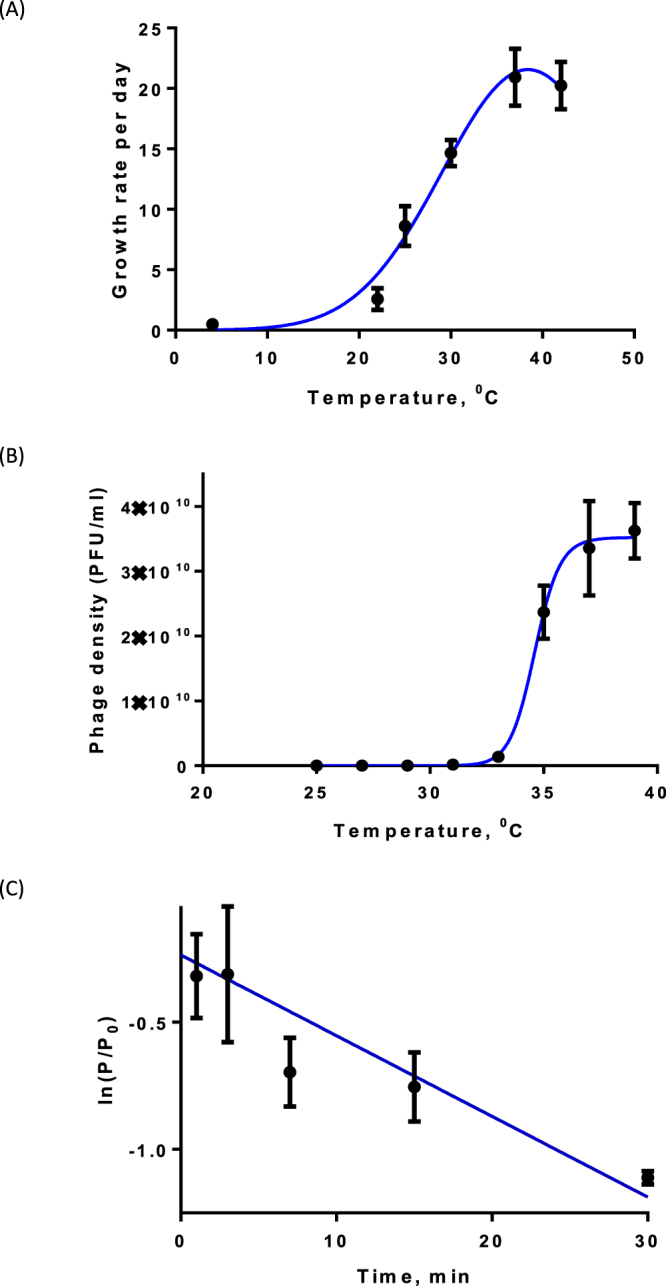
Figure 2.

Experimental estimation of the key model parameters. (A) Dependence of the growth rate of B. pseudomallei on temperature using the experiments of Chen and co-authors34. (B) Bacteria-phage interactions depending on the temperature (data from this study). The graph shows the density of free phages (see SM1). Appearance of a large number of phages at approximately 34 °C signifies a switch between lysogenic and lytic infection types; (C) Binding of phages to bacterial cells (data from this study). The graph shows the natural log of the ratio of the initial number of free phages and the density of phages at time t (see SM2). For each experiments, fitting of curves was done using the GraphPad Prism software. For details, see the main text.
