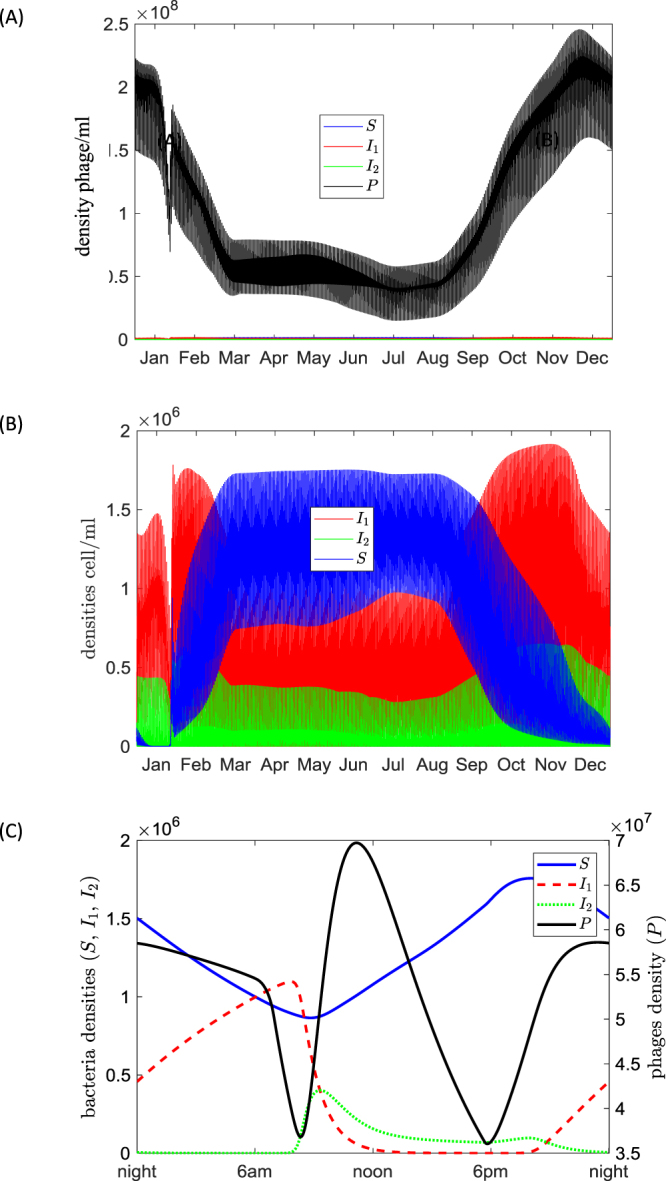
Figure 4.

Seasonal and daily dynamics of the bacteria-phage system predicted by Model I for the temperature and solar radiation records corresponding to the Nakhon province. (A) Seasonal variation of free phage density. (B) Seasonal variation of free-phage bacteria (blue curve), lysogenic bacteria (red curve) and bacteria in the lytic state (green curve). (C) Daily variation of bacterial (coloured curves) and phage (black curve) densities on April 1st. The model parameters are taken from Table 1 as default values. The unit of the densities of bacteria and phages are cell/ml and phage/ml, respectively.
