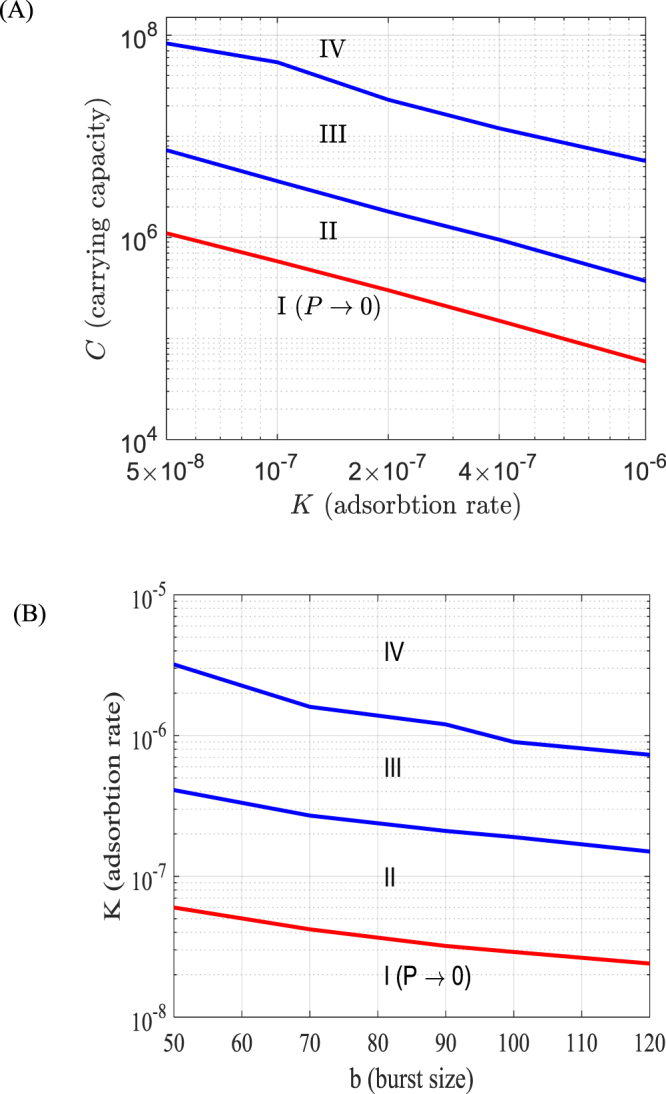
Figure 6.

Bifurcation diagrams showing possible dynamical regimes in Model I (Nakhon province) depending on the parameters K (overall phage adsorption rate); C (carrying capacity of bacteria) and b (burst size of phages). The curves in the diagram demark regions with different dynamical patterns: domain I signifies extinction of phages; domains II–IV correspond to the co-existence of bacteria and phages via patterns of dynamics shown, respectively in Fig. 5A,B,C. The red curve is the boundary of the parameter domain where the phage population goes extinct. Other parameters are taken from Table 1 as default values.
