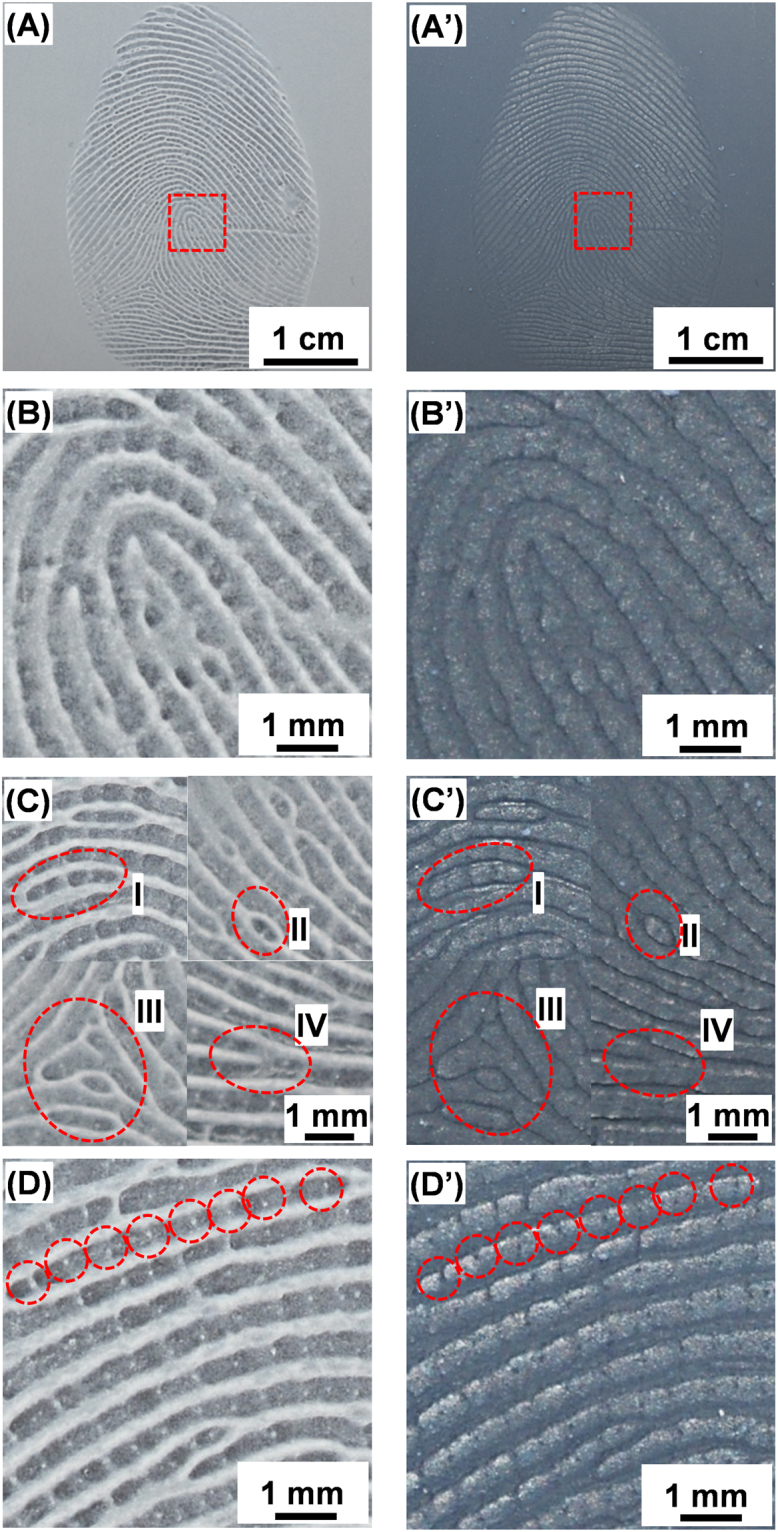
Figure 3.

Optical imaging of the PC fingerprint mold (left) and PDMS phantom (right). (A)/(A’) shows the entire fingerprint, which represents the first level details; (B)/(B’) a magnified section showing the fingerprint core; (C)/(C’) selected second level details such as islands (I), incipient (under developed) ridges (II), delta (III), and bifurcation (IV); (D)/(D’) a high magnification image showing the third level details, i.e., sweat pores along a fingerprint ridge (as highlighted).
