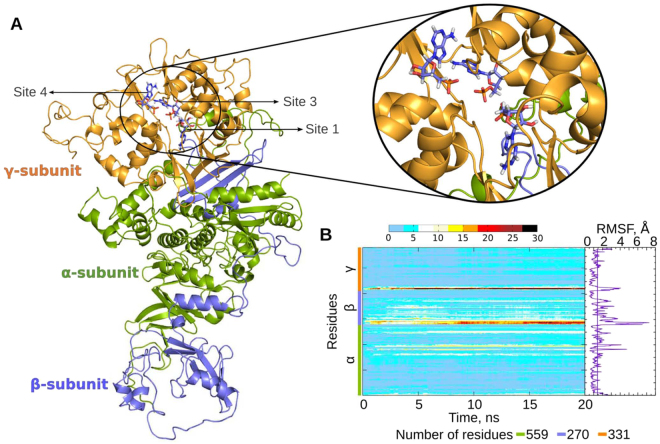
Figure 3.
Molecular modelling of AMPK. (A) Complete structure of AMPK heterotrimeric complex with co-crystallized AMP molecules. The missing residues from the incomplete crystallographic structures were homology modeled. α, β and γ subunits are shown in green, blue and gold colors respectively. AMP molecules in the complex are shown in blue sticks. Inset shows a closer view of the three AMP bound sites in the γ subunit; (B) Heatmap showing residue-wise RMSD contribution of AMPK across the trajectory. The color code in the heatmap plot represents the RMSD value for each of the amino acids at a given time-frame. Root mean square fluctuations (RMSF) of the Cα atoms in the AMPK heterotrimeric complex are also shown. The vertical line in the RMSF plot represents the mean RMSF of the complex.

