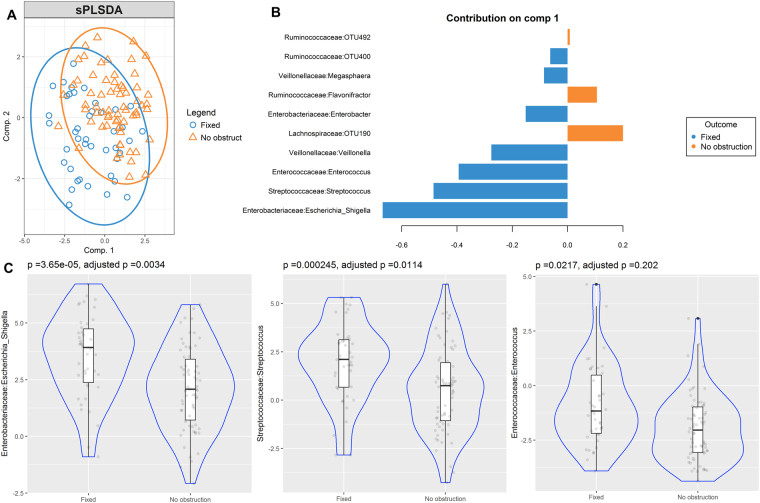
Figure 2.
Partial least squares discriminant analysis of gut microbiome composition between patients with fixed airway obstruction versus no obstruction sPLS-DA plot based on the relative abundance of bacterial taxa of gut microbiota from patients with fixed airway obstruction (blue circle) or without obstruction (orange triangle) and their 95% confidence ellipses (A). Contribution plot indicating genera contributing to component 1 of the sPLS-DA plot that discriminate these phenotypes (B). The abundance of the most consistent OTUs was compared using Metagenomeseq and presented on a violin plot, which includes the median, 95% CI, IQR, and density plot where the width of the blue lines indicate frequency (C).

