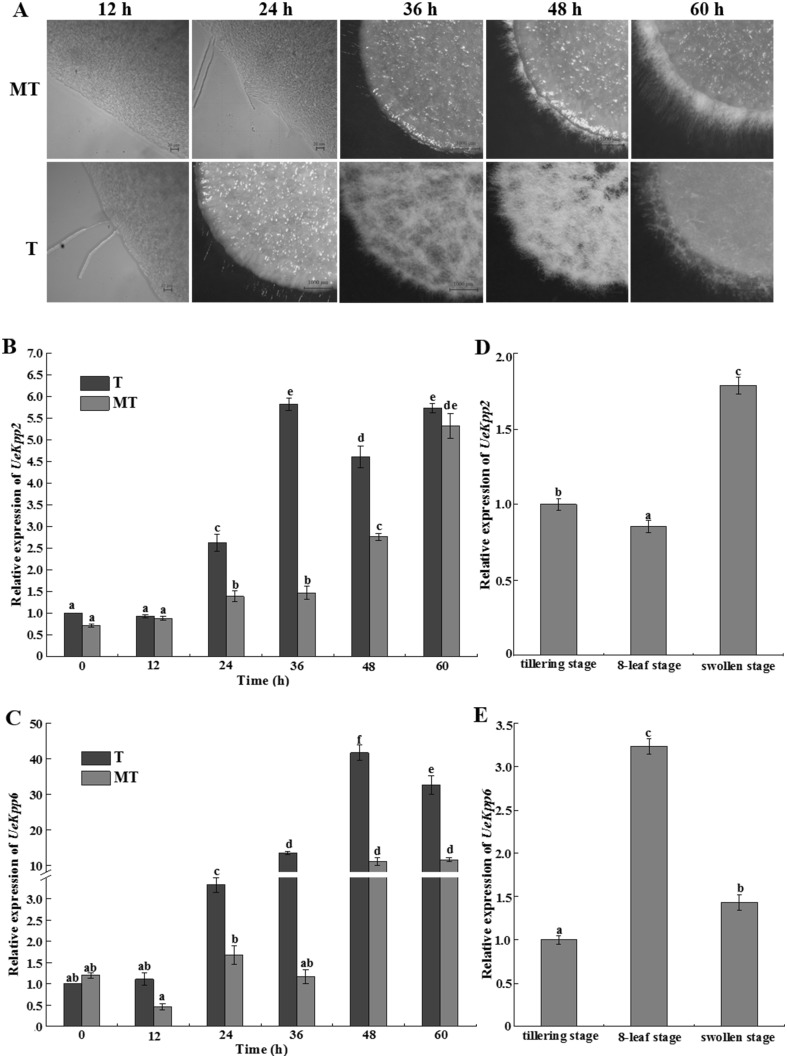
Fig. 2.
The relative expression of UeKpp2 and UeKpp6 during mating and infection progress. a Mating phenotype of MT and T type strains at different time with 12 h intervals. Earlier photos were taken by an ordinary microscope with the bars of 20 µm; Other images were taken by a stereomicroscope with the bars of 1000 µm; Relative expression of UeKpp2 (b) and UeKpp6 (c) were analyzed during different mating time; Relative expression of UeKpp2 (d) and UeKpp6 (e) during infection progress were also analyzed. β-Actin was used as an internal control. Data were reported as means ± SD of three repeated samples. All data were subjected to statistical analyses according to the Duncan’s method. The probability values of P < 0.05 were considered as significant and reported with the letter notation

