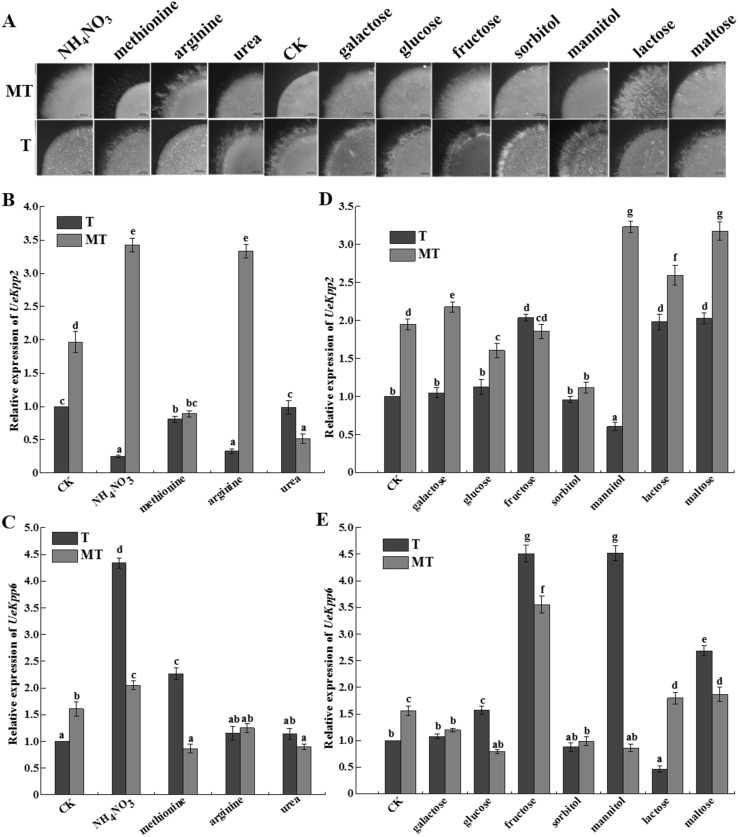
Fig. 3.
The expression patterns of UeKpp2 and UeKpp6 under distinct nitrogen or carbon source treatments. a Mating phenotype of MT and T type strains on a solid culture medium with different nitrogen and carbon sources. Images were taken after 3 days by a stereomicroscope. Bars indicate 1000 µm. Relative expression of UeKpp2 (b) and UeKpp6 (c) in distinct nitrogen sources were analyzed; Also, Relative expression of UeKpp2 (d) and UeKpp6 (e) were analyzed in distinct carbon source treatment. The relative expression in the control medium with sucrose (50 mM) and KNO3 (20 mM) was taken as one fold relative expression sample. β-Actin was used as an internal control. Data were reported as means ± SD of three repeated samples. All data were subjected to statistical analyses according to the Duncan’s method. The probability values of P < 0.05 were considered as significant and reported with the letter notation

