
Fig. 4.
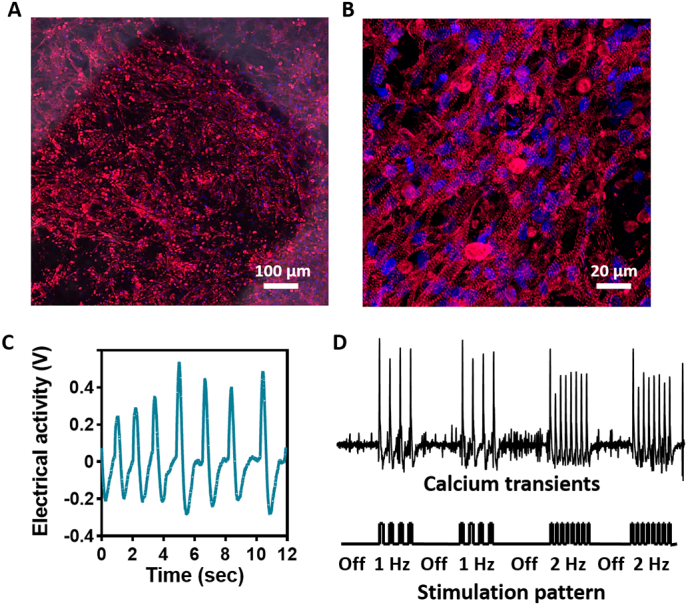
Tissue organization and function within the electronic scaffold. (A) Confocal microscope image showing the assembled cardiac tissue on and around the Au electrode. Red - sarcomeric actinin, blue - nuclei. (B) Zoomed-in image of cardiac cells revealing elongated cells and a massive striation. (C) Extracellular signals recorded from a sensing electrode within the electronic scaffold. (D) Calcium transients recorded as a function of stimulation through the electronic scaffold. (For interpretation of the references to colour in this figure legend, the reader is referred to the web version of this article.)